Gradually, Then Suddenly
Personal views and market commentary. Not investment advice. Not associated with any employer or firm.
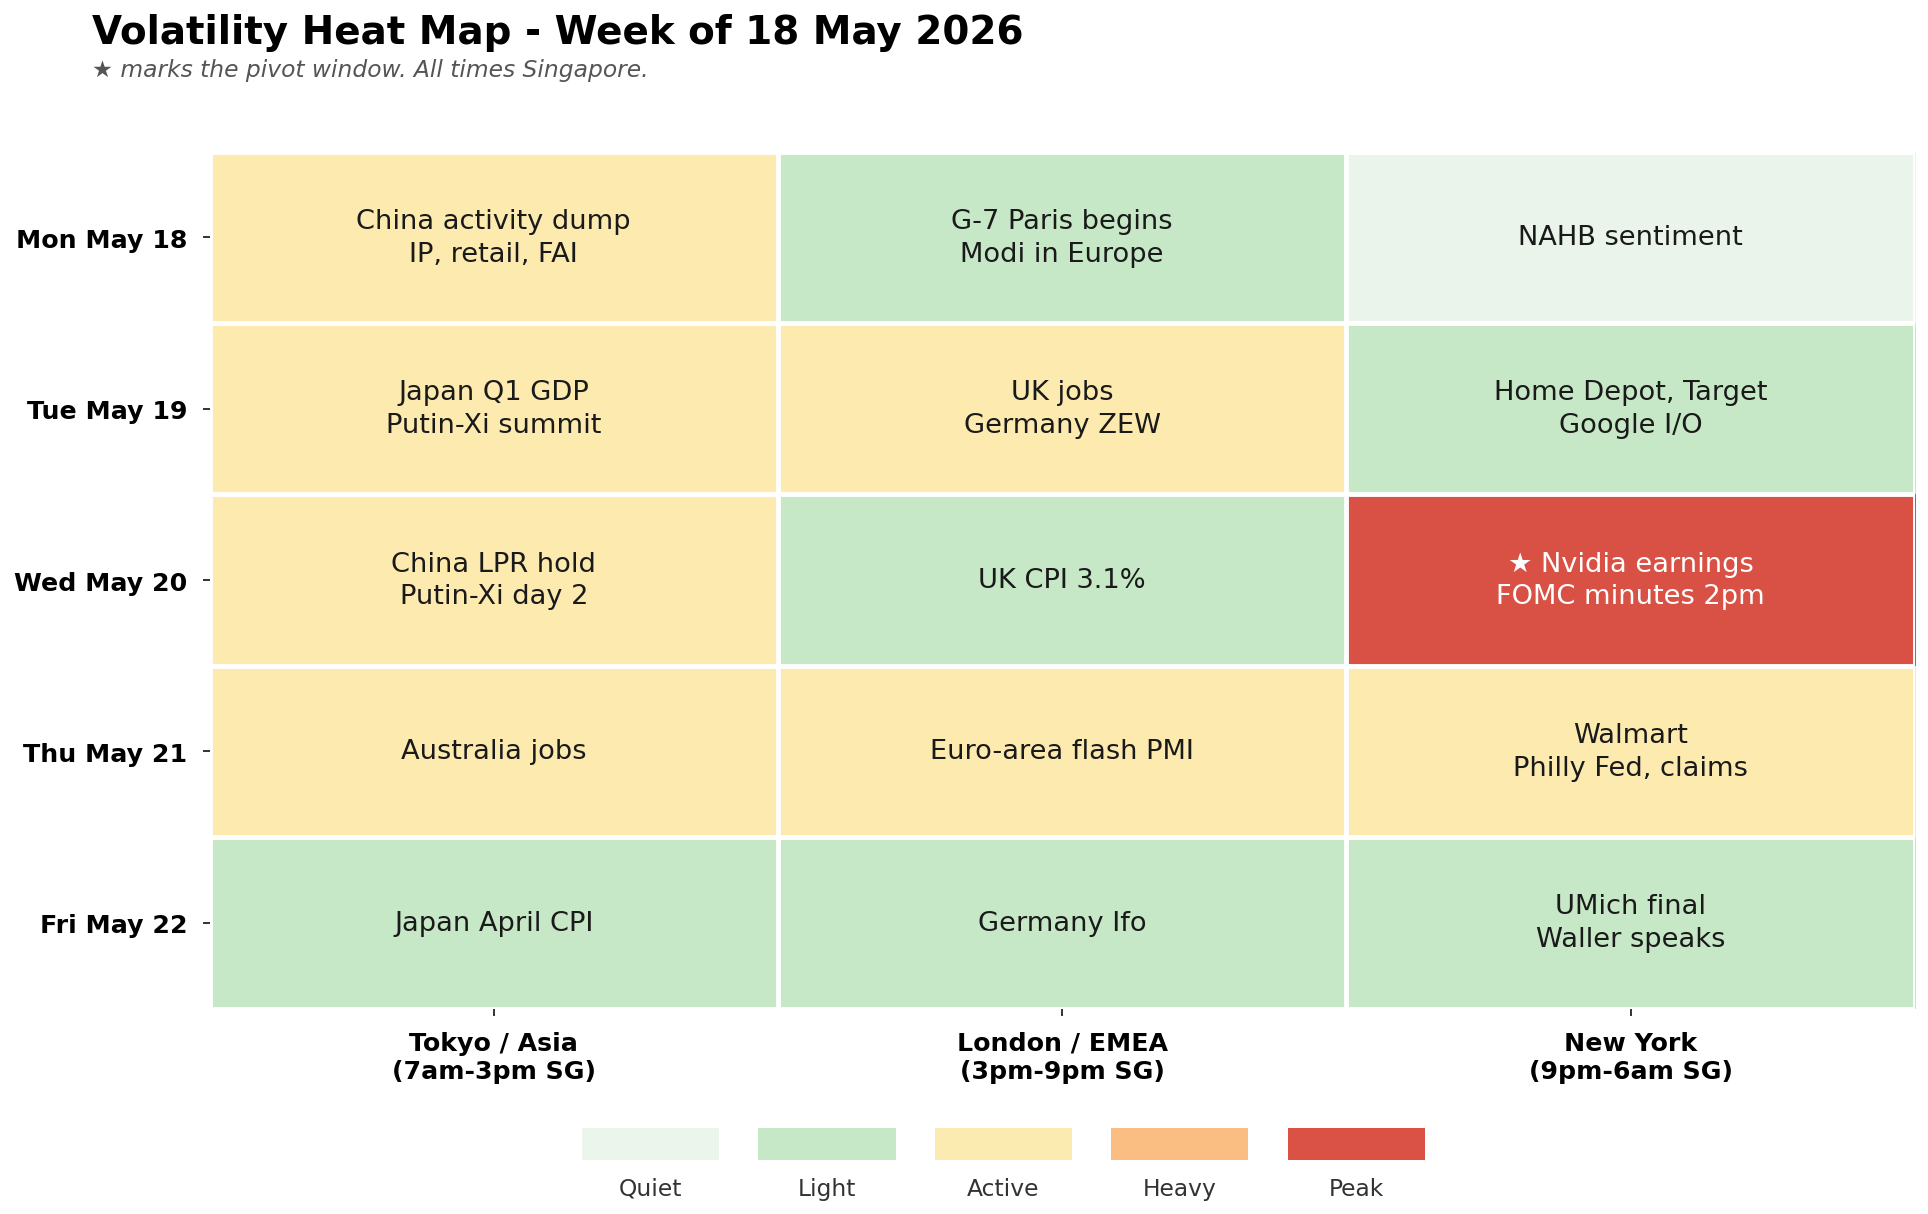
Volatility heat map for the week ahead, all times Singapore. The pivot is Wednesday in the New York session, when Nvidia earnings and the FOMC minutes land on the same afternoon. Monday opens with the China activity dump and the G-7 gathering in Paris. Putin lands in Beijing to meet Xi on the 19th and 20th. Thursday is the second test, Walmart plus the euro-area flash PMI plus Australian jobs. Friday fades by design. Size into Wednesday, keep powder for the Thursday PMI read, clear the desk before the weekend.
"Can China and the United States create a new paradigm of major-country relations?" — Xi Jinping, to Donald Trump at the Great Hall of the People, Beijing, May 14. Underneath the question sits the phrase Beijing keeps returning to, the Thucydides Trap. Coined by Harvard’s Graham Allison from the ancient historian’s account of the Peloponnesian War, the idea is that when a rising power challenges an established one, conflict tends to follow. Allison counted sixteen cases over five hundred years, twelve ended in war. Xi has invoked it since at least 2014. Citing it does two things at once. It signals Beijing wants coexistence, not confrontation. And it quietly reframes the relationship, lifting it above tariffs and Taiwan into a contest of equals. The summit produced little of substance. The framing was the substance. For markets the read is that US-China is now managed as a structural rivalry, not a trade negotiation, and that is a multi-decade risk premium, not a headline.
"How did you go bankrupt? Two ways. Gradually, then suddenly." — Ernest Hemingway, The Sun Also Rises. The bond market spent two years going gradually. Last week felt like the start of suddenly.
"I’m a gold perma-bull. Right now I’m short. When the marginal central bank flips from structural buyer to forced seller, gold’s biggest bid disappears." — Jeff Currie, on X. Even gold bulls have to read the tape. His path: short here, then gold 4,000, then 10,000.
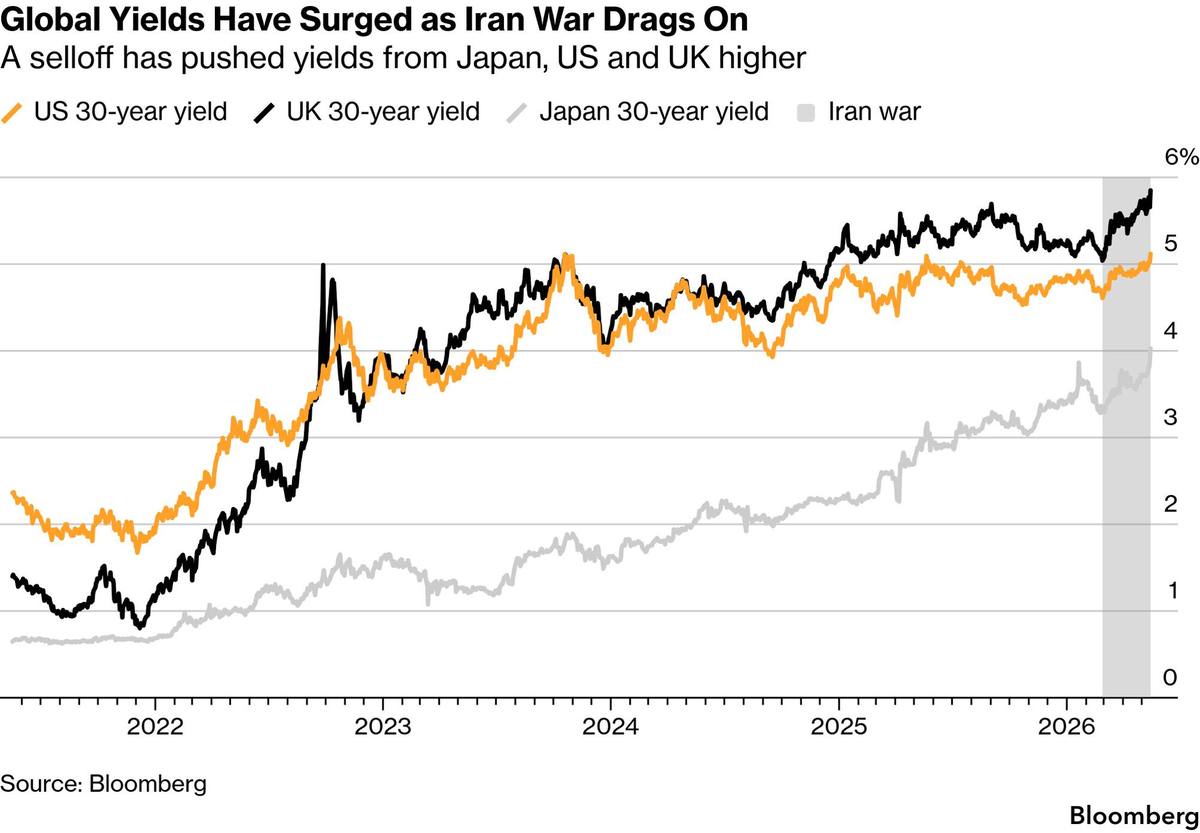
Government bond markets fell together last week, from Japan to the US, yields surging on the fear that the war's energy shock forces central banks to tighten. The UK 30-year gilt reached 5.80%, the highest since 1998. Japan's 30-year crossed 4% for the first time since 1999. The US 10-year pressed toward 4.60%, the 30-year held above 5%. A synchronized sell-off is not a series of local stories. It is one story, that the market no longer believes the next move in rates is down. Source: Bloomberg.
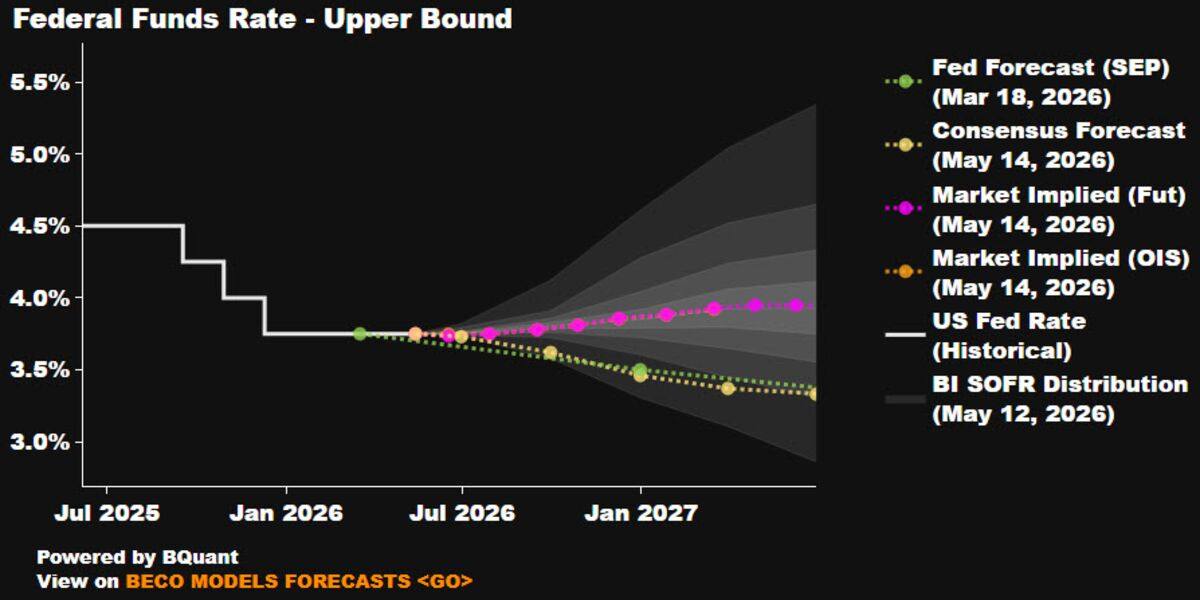
Market pricing still sees the Fed on hold through 2026. This is the chart the entire week argues against. Even as futures have begun to price a full hike by mid-2027, the consensus path embedded here leans toward a long pause. Hot CPI, hotter PPI, an Atlanta nowcast at 3.7%, and a new chair who inherits five years of above-target inflation. The gap between what this chart says and what the data is doing is the trade. Source: Bloomberg.
What is the plan this week?
Last week the bond market stopped being the background and became the story. A synchronized sell-off ran from Tokyo to London to New York, the UK 30-year gilt at a 1998 high, Japan’s 30-year through 4% for the first time since 1999. The S&P touched 7,500 and closed the week flat. Friday felt smokey, the kind of tape where the index holds but the air underneath thins. Records and the warning in the same week, and the warning was the louder signal.
A correction first, because process matters more than the position. I went into last week short USDJPY on the view that an Iran resolution pulls oil lower for a trade. That was wrong. The inflation wind is far stronger than the resolution trade, and last week it showed up in the US data with force. April CPI accelerated to 3.8%, outpacing wages for the first time in three years, and PPI was worse, monthly prints three times consensus. I stopped the short and flipped long dollar. The US still looks like the best economy in the world by a distance, exceptionally so, and the Atlanta nowcast has Q2 tracking 3.7%.
This week’s trade is the further repricing of the US curve. The front end has already moved a long way, futures now at a full hike by mid-2027, and the question is whether they have to price more. With inflation sticky and the oil view flat to higher, the Fed will have no choice. Here is the dislocation worth staring at. The MOVE index, the bond market’s fear gauge, is climbing with rates, yet FX volatility is still pinned near multi-year lows. Those two cannot stay apart. Either rates vol comes down, or FX vol catches up, and the second is how a VAR shock arrives, in a market positioned for a calm that has not existed for weeks. The bond vigilantes are waking up and duration is going to be challenged.
But we have seen this movie. Trump threatens, then walks it back, the TACO reflex is real, and Bessent will find the words to calm the tape, because the yield curve is the administration’s Achilles heel and they know it. The genuinely open question is the new man. What will Warsh do. He inherits a Fed that has run above target for five years, a market pricing his first move as a hike rather than a cut, and a committee that handed Powell the highest dissent count since 1992. He cannot deliver the cuts the White House wants in this regime, and he is too orthodox to pretend otherwise.
The harder question is equities. Friday felt like the start of a market losing a little of its overvaluedness, and Wednesday concentrates the test, Nvidia earnings and the FOMC minutes on one afternoon, Nvidia already stretched with RSI in the high seventies and price above its upper band. None of this dents the bigger truth that the US is outperforming exceptionally. On the geopolitical board, watch the calendar. Putin visits Xi in Beijing on 19 and 20 May, days after the Trump-Xi summit, and the real question is whether we are now watching Trump, Xi and Putin move into a loose synchronisation, each managing a war or a rivalry toward a pause rather than a resolution. That is a different world from the one the risk premium is priced for.
The plan this week. The core is long dollar and paid the US short end, sized up. The curve repricing is the dominant trade in global markets and the crowd is offside. If the FOMC minutes Wednesday confirm the easing bias is gone, it runs. If Trump and Bessent jawbone the curve back, the entry improves and the thesis does not break. Against the crowd, short AUD and CNH, the carry longs that have had their run and are most exposed to the paradigm shift. The hedge is a short yen cross, EURJPY or AUDJPY. The one event that breaks the dollar trade is the MOF moving boldly near 159, and a yen-cross short pays exactly there. Gradually, then suddenly.
What did I learn last week?
Mon May 11: Iran deployed deep-roaming submarines in the Strait of Hormuz. Netanyahu said the war is "not over" until enriched uranium is removed. Treasury’s $58B 3-year auction tailed at 3.965%. Aramco’s CEO warned the war could disrupt oil into 2027, though the company can reach 12M bpd within three weeks if needed. FSK cut its dividend 12.5%, the second BDC cut after OBDC. Mosaic missed badly.
Tue May 12: Germany ZEW current situation -77.8. ECB’s Nagel said hikes are increasingly likely, the adverse scenario now base case. IRGC expanded the Hormuz operational zone to Jask and Siri. Atlanta sticky CPI ran 4.6% annualized. Treasury’s $42B 10-year auction tailed at 4.468%. Samsung’s union strike forced an emergency cabinet meeting in Seoul.
Wed May 13: Trump-Xi summit at the Great Hall of the People. Treasury’s $25B 30-year auction tailed badly, 5.046% versus 4.750% prior. The Senate confirmed Warsh as Fed Chair, 54-45. The IEA warned global oil supply will plunge below demand on a record inventory draw. Cisco beat and raised. Alibaba’s Q4 was messy.
Thu May 14: Xi met US business leaders. Trump said China will buy US oil and farm goods. Rubio said China’s preference is to take Taiwan willingly. The Apple-OpenAI partnership is fraying toward a legal battle. Cerebras IPO’d, opening at $350 against a $185 price, 230x sales.
Fri May 15: Trump made no commitment on Taiwan. April industrial production +0.7% versus +0.3% expected. May Empire manufacturing 19.6 versus 7.2, prices-paid 62.6. SpaceX confirmed a Nasdaq IPO for mid-June.
All week: S&P touched 7,500 then closed flat, Nasdaq -0.1%, exhaustion at the top. The bond market was the story. UK 30-year gilt 5.80%, highest since 1998. Japan 30-year through 4%, first since 1999. US 10-year near 4.60%, 2s-10s steepened to 51.8bp. Brent $109. DXY +1.4%, best week since March. All three Treasury auctions tailed.
What to look out for next week?
Mon May 18: China April activity, industrial production +5.7%, retail sales +1.6%, fixed-asset investment +1.5%, property prices still falling. Thailand Q1 GDP +2.2%. Swiss GDP +0.4%. G-7 finance ministers and central bank governors in Paris through May 19, focus on global imbalances, trade and FX policy. Modi tours Europe. The Israel-Lebanon ceasefire expired Sunday. NAHB homebuilder sentiment. Ryanair earnings.
Tue May 19: Japan Q1 GDP, +0.4% q/q and +1.4% annualized. UK labour data, pay growth easing to 3.1%, unemployment 4.8%. Putin arrives in Beijing to meet Xi, through May 20. Malaysia CPI +2.1% on the oil shock. Canada CPI, expected to accelerate to 2.9%. Australia Westpac confidence and RBA minutes. US pending home sales. Earnings: Home Depot, Target, TJX, Intuit. Google I/O opens.
Wed May 20: Nvidia earnings, revenue a record ~$79B, +79%, the AI bellwether into a stretched tape. FOMC minutes from the April 28-29 meeting, Powell’s last, expected hawkish. China loan prime rates, hold at 3.00% and 3.50%. Bank Indonesia, hold at 4.75%. UK CPI, expected to ease to 3.1%. Treasury $16B 20-year. Lowe’s earnings.
Thu May 21: Walmart earnings, smallest US same-store gain in two years. Euro-area flash PMI, April collapsed to 48.8, the ECB’s dilemma. Australia jobs, +15k expected, unemployment up to 4.4%. US Philly Fed, jobless claims, housing starts, KC Fed. Treasury $19B 10-year TIPS. European Commission spring forecasts. Earnings: EasyJet, Deere, Workday.
Fri May 22: Japan April CPI, expected 1.7%, keeping the BOJ on a June-hike path. Germany Ifo, last at 84.4, the lowest since May 2020. UMich final May, confirming the record-low 48.2. NZ retail sales. Mexico GDP, activity and CPI. UK and Canada retail sales. Fed’s Waller speaks in Frankfurt. Earnings: Richemont, Julius Baer.
All week: Nvidia and Walmart the marquee. G-7 Paris, Modi’s Europe tour, and the Putin-Xi summit on 19-20 May, watch for signs of a Trump-Xi-Putin alignment forming. Heavy flash-PMI Thursday across the US, euro area, UK and Japan.
Beyond next week
May 29: US April PCE, the print that confirms or breaks the CPI/PPI heat.
Late May: OPEC+ ministerial without UAE. Saudi retaliation through unilateral output cuts the live tail.
June 11: ECB decision, swaps near 80% for a hike. SpaceX IPO prices.
June 17-18: BOJ and BOE decide. BOJ swaps around 75% for a hike to 1.0%.
Mid June: Warsh’s first FOMC, the Summary of Economic Projections re-thought. Watch whether the first move under the new chair is, improbably, up.
Regimes
US Exceptionalism repriced, the dollar bid returns. Hot CPI and PPI, an Atlanta nowcast at 3.7%, DXY’s best week since March. The US is re-accelerating while Europe weakens and the UK frays. The short-dollar trade of April is over. Long dollar, the core. changed, week 1
The hike nobody priced becomes the base case. Futures at a full hike by mid-2027, December funds pricing up 75bp since the war. Warsh inherits a market pricing his first move as up. The US yield curve is the most important repricing in global markets. Paid the US short end. new, week 1
Synchronized sovereign bond stress, UK and Japan the weak links. A global sell-off, not local stories. Gilt 30-year at a 1998 high, JGB 30-year through 4%. Both currencies fell as yields rose. Short a yen cross. new, week 1
Credit stress sharpening, the BDC discount widens. Public BDCs trade near 85% of net asset value, the steepest discount since 2020. FS KKR and Carlyle cut dividends, Blue Owl and Sixth Street posted losses, and non-traded fund redemptions topped inflows for the first time. No position, the canary. held, week 4
China rebalancing the oil market. Imports still a quarter below prewar, the structural bid for crude and the structural question for the bulls. No standalone trade, the support under the long-dollar thesis. held, week 2
Three regimes moved this week, a genuine structural break, and the book flipped inside it.
Shifts (if → then)
Hot FOMC minutes Wednesday → curve prices more hikes, dollar extends, AUD and CNH break. new
MOVE keeps rising while FX vol stays pinned at the lows → the gap closes the wrong way, FX vol catches up, the VAR shock arrives. new
Nvidia beats and raises but the tape sells it → stretched RSI, breadth divergence, the index cracks on good news. new
Nvidia disappoints → AI-bubble fear, NDX reprices hard, VIX spikes. new
AUD breaks $0.7100 → momentum unwind toward $0.7050, the RBA September hike repriced out. carried
MOF intervenes again near JPY159 → the JPY-cross shorts, EURJPY and AUDJPY, pay. new
UK CPI hot Wednesday into the Starmer challenge → gilt sell-off extends, sterling breaks $1.3300. new
Tails
VAR shock in an unprepared market → positioning wrong-footed, the curve shifts violently, forced deleveraging cascades. The one I most want flagged. week 1
Trump and Bessent fight the curve → verbal intervention first, then worse. The open question is whether Warsh holds the line or bends. week 4, evolved
Sovereign bond stress spreads from the UK or Japan → volatility in the weak G7 links jumps cross-asset into equities and credit. week 1
Hormuz blockade past Q2, the supply deficit turns physical → reserves at an eight-year low, oil $130, the masked deficit stops being masked. week 5
Trump, Xi and Putin move into loose synchronisation → the three manage their wars and rivalries toward holding patterns, not resolutions. The geopolitical risk map redraws, and not toward peace. week 1
Private credit contagion via the BDC complex → FSK and OBDC dividend cuts spread, the channel widens. week 4
AI capex air pocket → the spending is vast, fast and circular, and a Nvidia stumble cracks the whole stack. week 1
Manic Monday
China dominates the open. The April activity dump lands before the US wakes, industrial production, retail sales and fixed-asset investment all telling the same story of strong supply and weak demand. The G-7 finance ministers and central bank governors gather in Paris, with global imbalances, trade and FX policy on the table. Modi tours Europe. The Israel-Lebanon ceasefire expired Sunday. A busy open before a quiet middle.
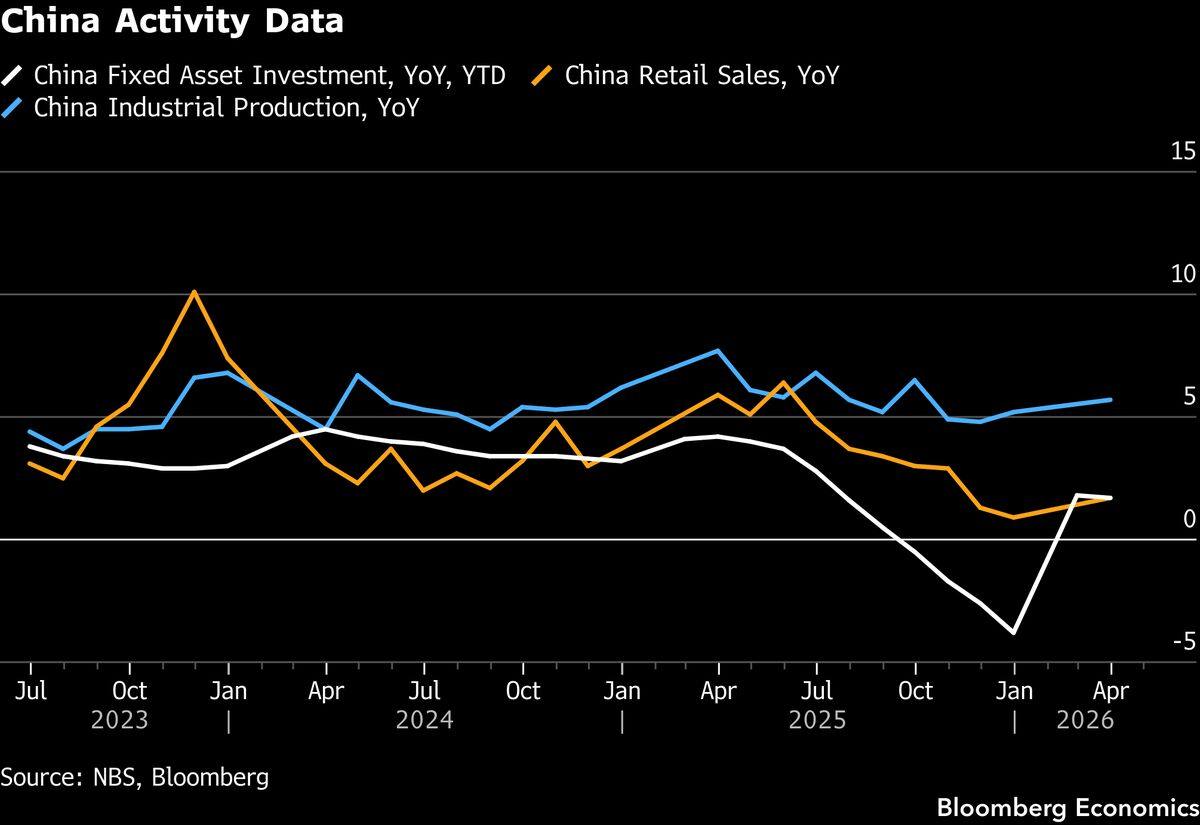
China April activity keeps the spotlight on the same imbalance, strong supply, weak demand. Industrial production likely held at 5.7% year-on-year, underpinned by resilient exports. Fixed-asset investment decelerated to 1.5%, retail sales edged down to 1.6%. Consumption stays sluggish on consumer caution, private investment is softening, construction is stumbling. The economy still runs on one engine. Source: Bloomberg.
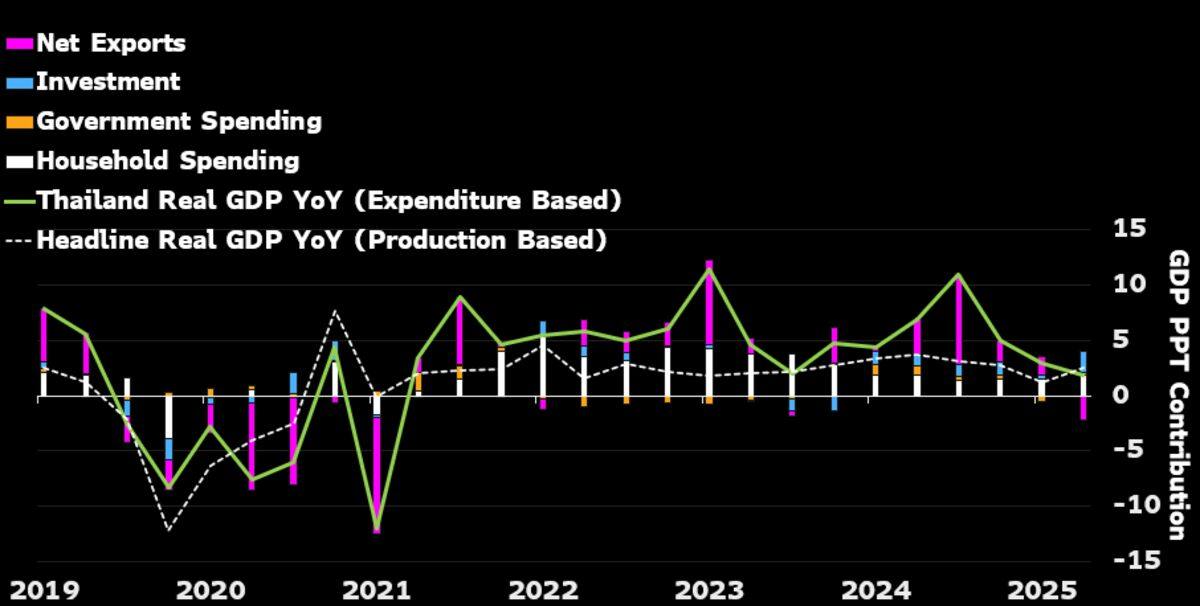
Thailand's economy slowed in 1Q26, GDP expanding an estimated 2.2% year-on-year from 2.5% in 4Q25. Weaker net exports and cautious household spending weighed, and higher energy prices began depleting spending power in March. Pushing the other way, foreign arrivals from China turned around, rising 11.8% after a 28.5% slump the prior quarter. A small economy caught between the tourism recovery and the oil shock. Source: Bloomberg.
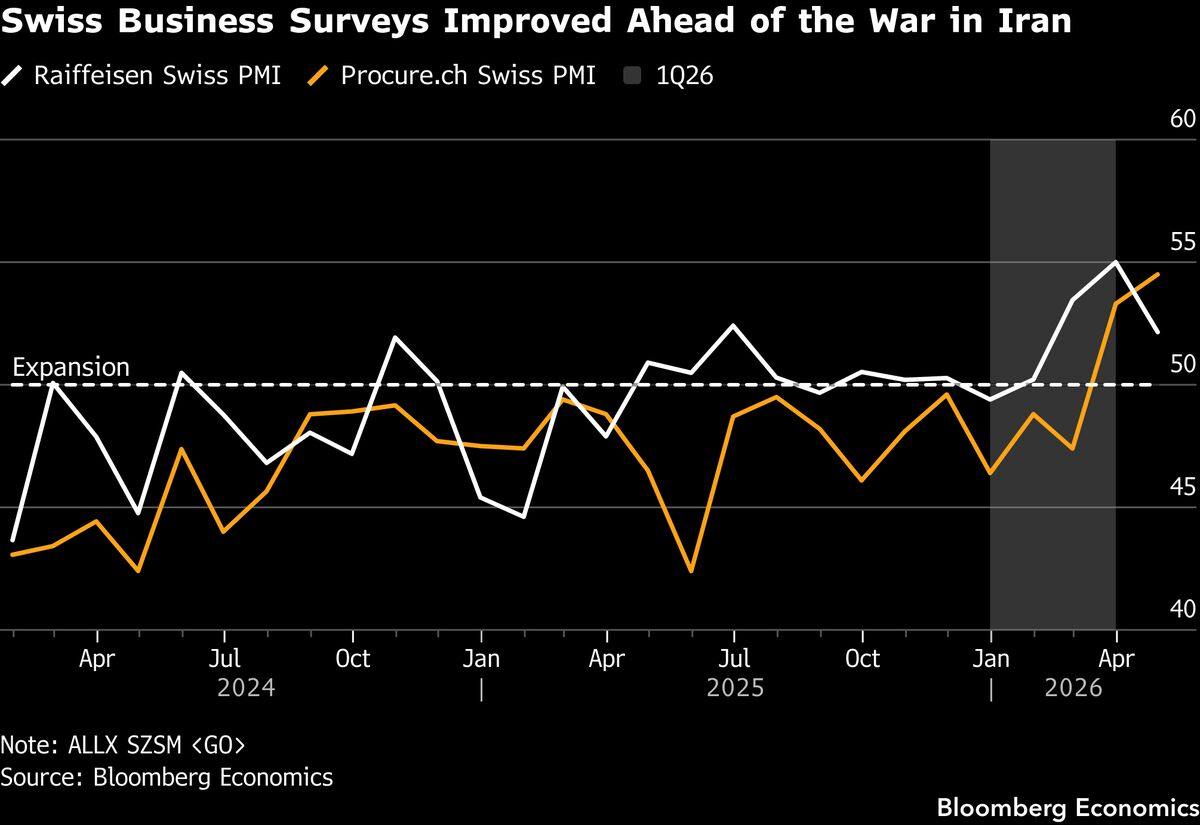
Swiss GDP is expected to rebound to 0.4% in 1Q26 from a modest 0.2% in 4Q25, the economy accelerating in the first months of the year before the Iran war's drag arrives in 2Q. Domestic demand stays resilient, investment supported by the SNB's accommodative stance, consumption underpinned by benign inflation. The data is the calm before the energy shock feeds through. Source: Bloomberg.
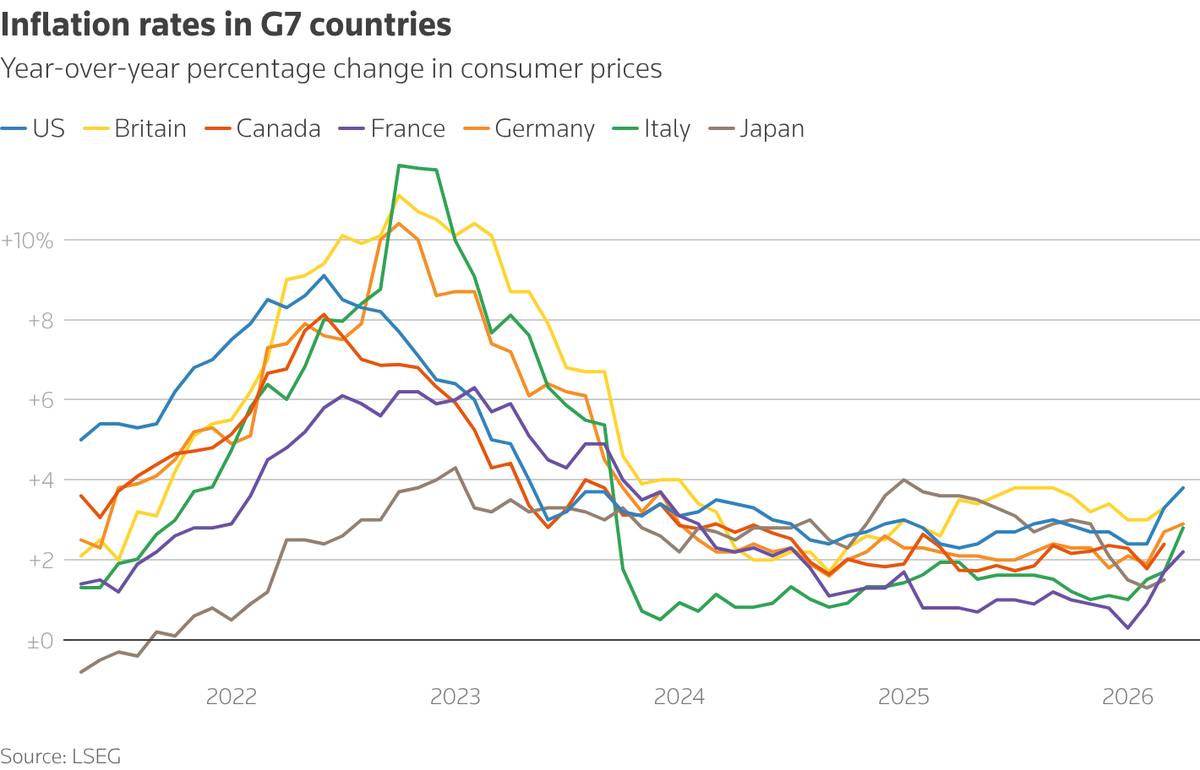
Inflation rates across the G7. The finance ministers and central bankers of the G-7 gather in Paris early in the week, with everything on the table, the Iran stalemate, critical-mineral supply chains, and FX policy. Oil sits comfortably above $100 a barrel. Bond markets from the UK to Japan to the US have been riled by rising inflation measures and a drastic shift in rate expectations. The chart is the backdrop to every conversation in the room. Source: Reuters.
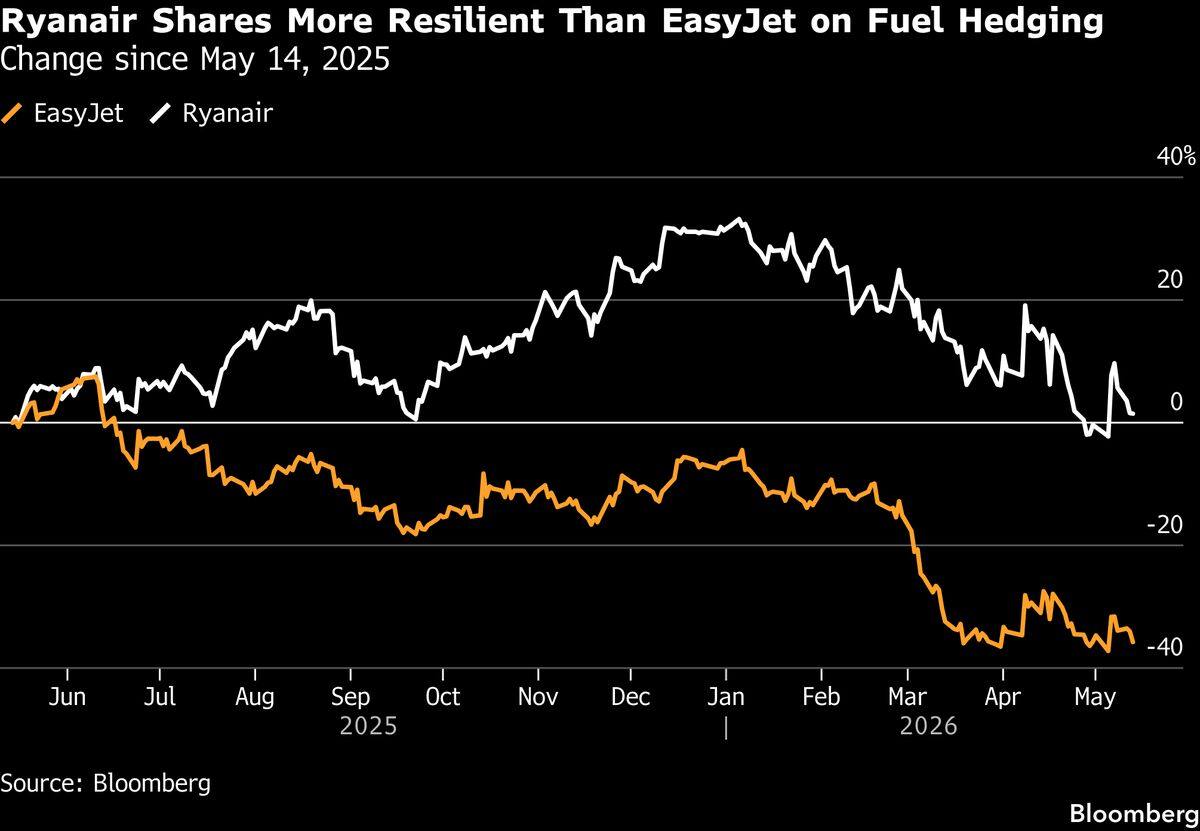
Europe's budget airlines brace for the fuel hit. Jet fuel costs have surged with the war, and the region's biggest carriers have flagged steep bills. EasyJet has already warned of a loss, with earnings estimates collapsing as the Iran war disrupted bookings. Ryanair is better hedged, only a modest cost rise it can offset through pricing. The summer travel season is the channel few have priced into airline earnings. Source: Bloomberg.
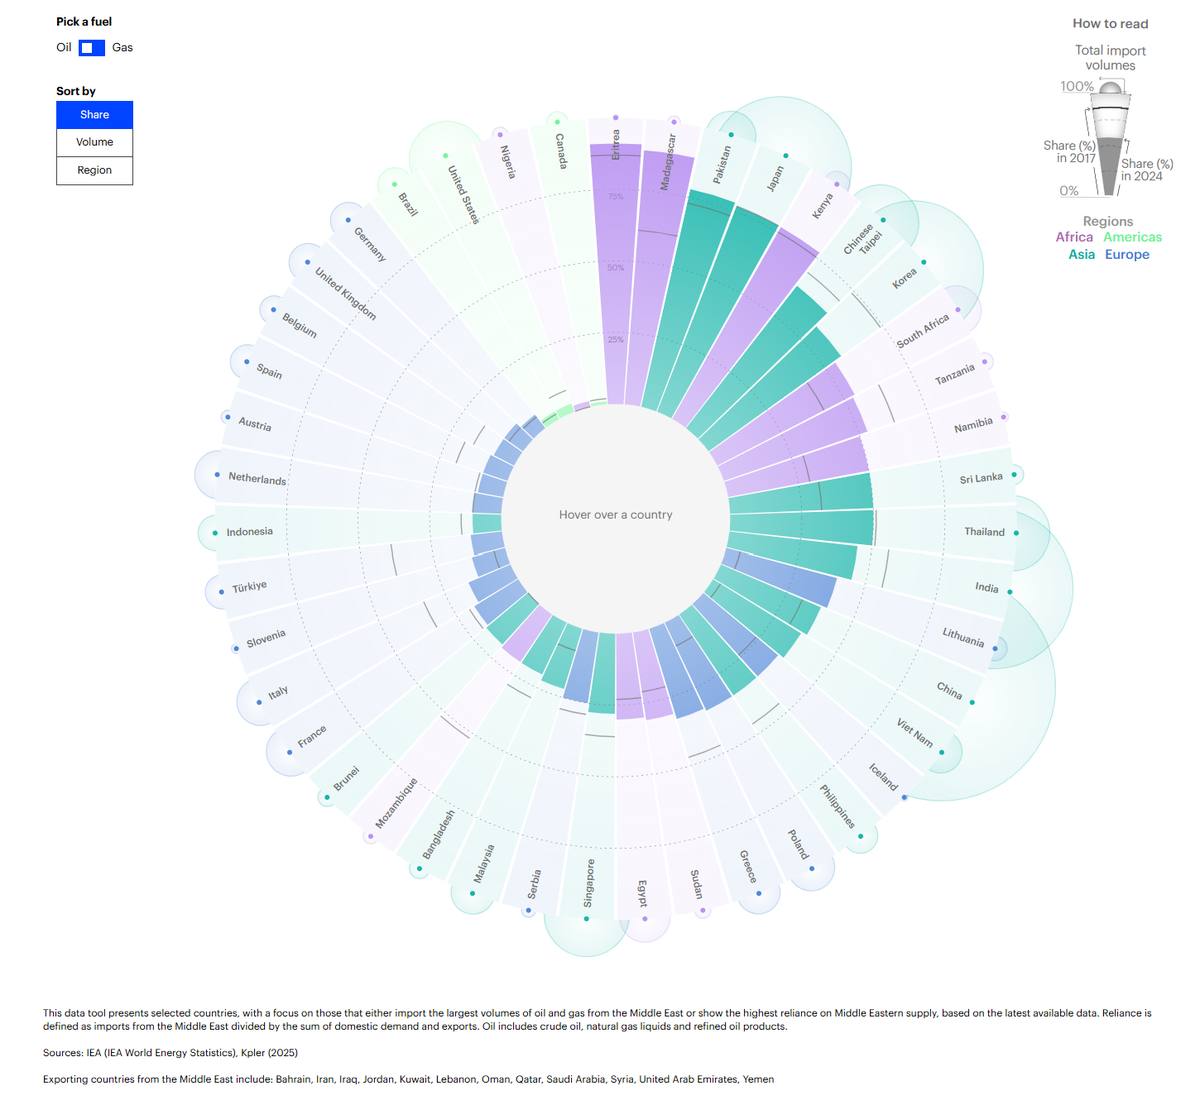
Reliance on Middle East oil and gas by country. The chart shows the share of each country's oil and gas consumption tied to the Gulf. Several economies across Asia and Africa source more than half their oil imports from the Middle East. Japan and the Philippines, at 77% and 34% of crude imports from the Gulf, have implemented emergency measures. India and South Korea are rationing fuel, and many European economies are capping oil prices to shield consumers from the largest energy shock in modern history. Explore the IEA interactive. Source: IEA.
Turnaround Tuesday
Japan Q1 GDP and UK labour data anchor the morning, the inflation question building underneath both. Putin lands in Beijing. Malaysia and Canada CPI test how far the oil shock has travelled. Australia confidence and the RBA minutes. The US retailers begin, Home Depot, Target and TJX reporting into a squeezed consumer. Google I/O opens. The day the consumer side of the tape gets its read.
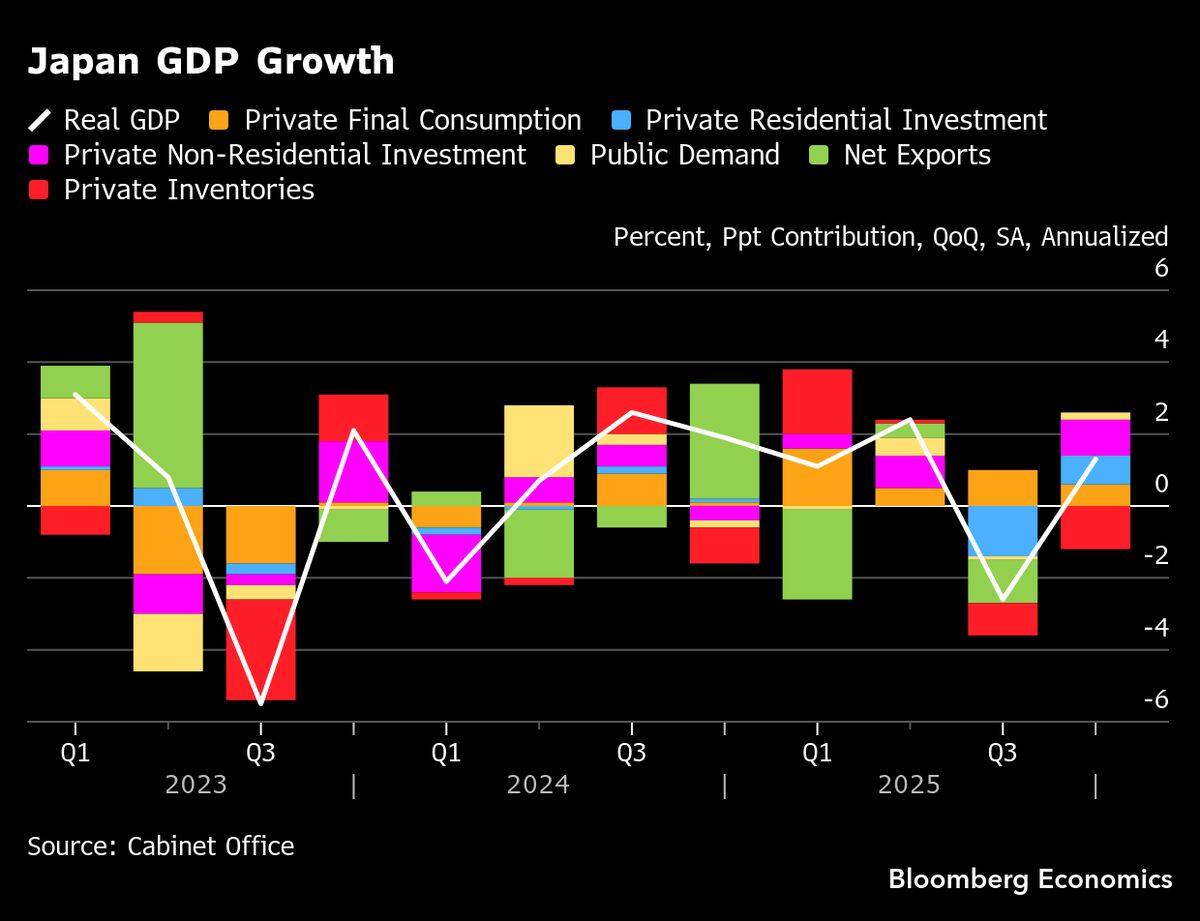
Japan Q1 GDP likely grew at a solid pace, an estimated 2.2% quarter-on-quarter annualized after 1.3% in 4Q25, well above potential of around 0.5%. Strong auto exports and a rebound in public investment carried the quarter, household consumption lifted by stronger real wages. The data shows an economy in good shape before the war. From 2Q, tighter oil supply weighs on exports and consumption. Source: Bloomberg.
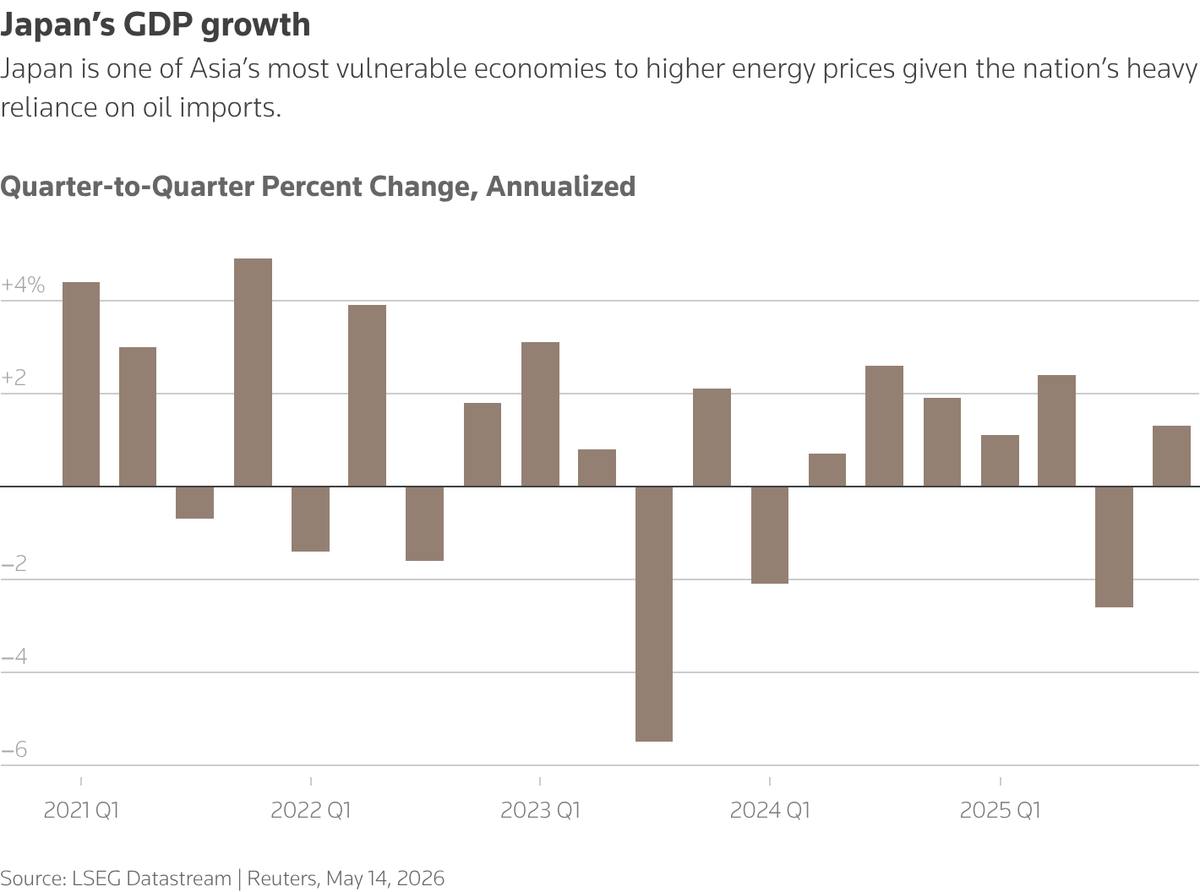
Japan's quarter-on-quarter annualized GDP growth. Tuesday's release offers an early read on how the energy-price surge is weighing on an economy heavily reliant on oil imports. Trade and inflation figures follow later in the week, the latter potentially reinforcing the case for a near-term BOJ rate hike. The swaps market has roughly 75% odds of a June move to 1.0%, and about the same for another before year-end. Source: Reuters.
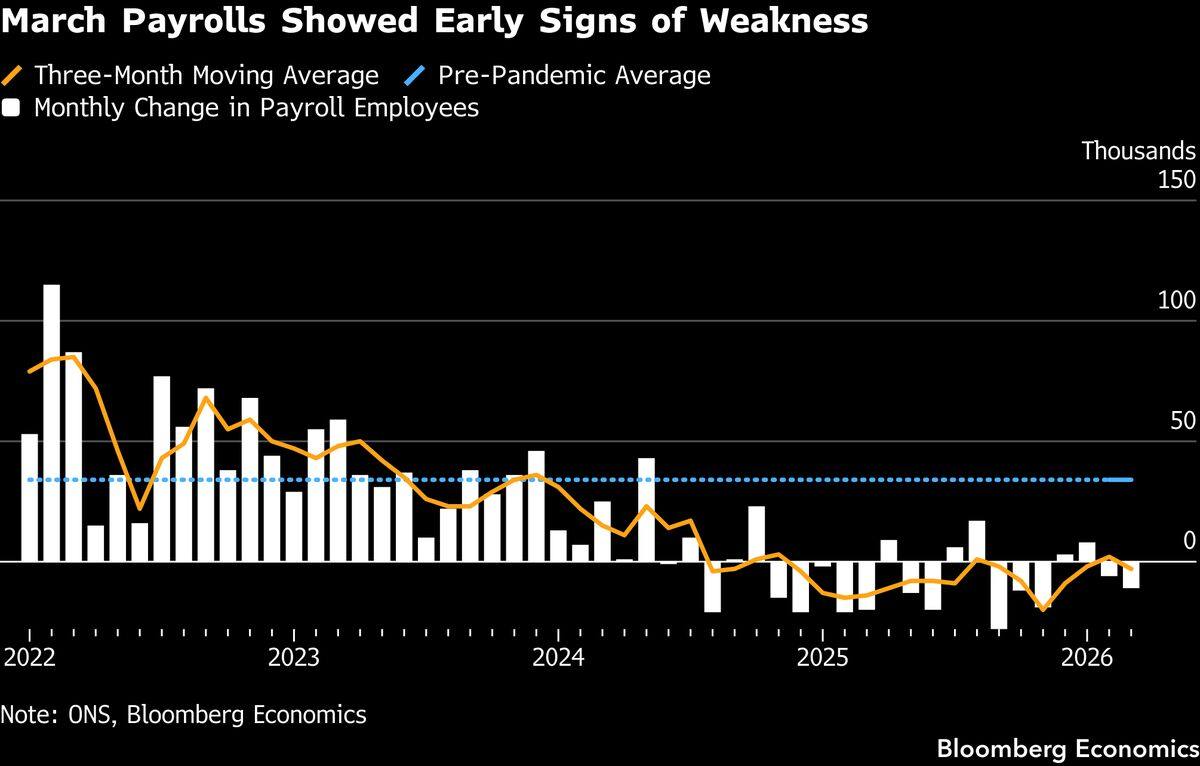
UK labour data likely shows private-sector regular pay growth slowing to 3.1% in the three months to March, with unemployment dropping to 4.8%. The picture is of a jobs market that, before the Iran war's fallout, may have been turning a corner but was still soft enough to bring inflation to heel. Payrolls and vacancies have already flagged weaker demand. Pay gains are unlikely to respond much to the energy-fuelled rise in inflation. Source: Bloomberg.
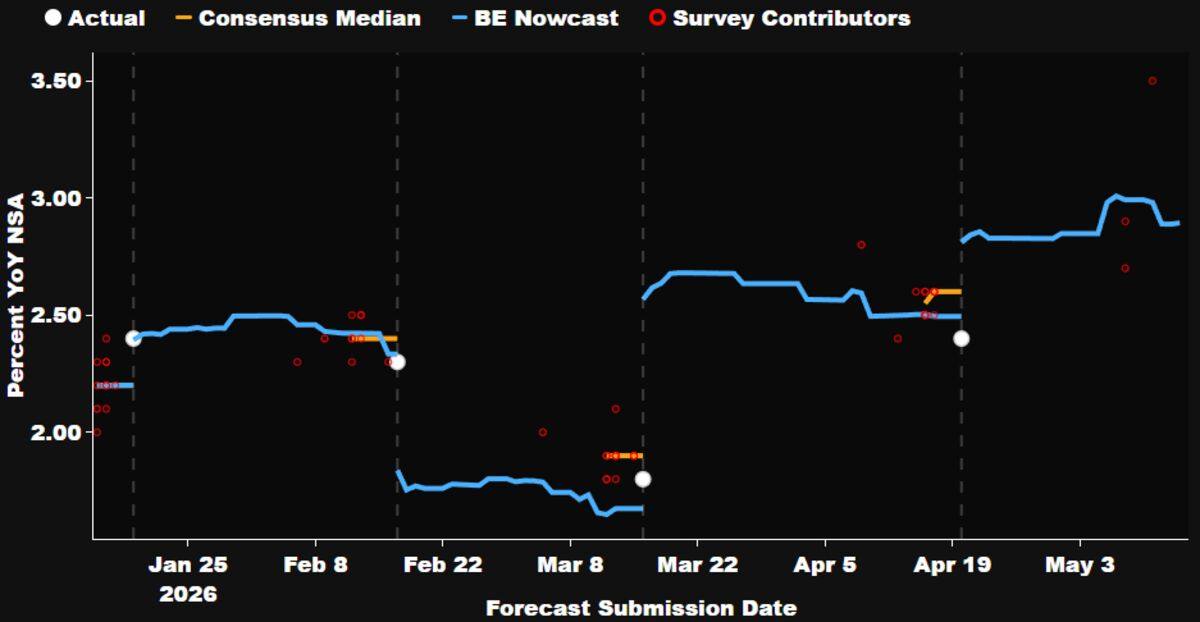
Canada's headline inflation set to rise further. April CPI likely accelerated to 2.9% year-on-year from 2.4% in March, lifted by energy prices and a near-9% jump in auto fuel. Last April's 0.1% decline dropping out of the comparison amplifies the increase. Producers reported rising costs, but soft demand limited the pass-through into discretionary categories. The Bank of Canada is watching for how synchronized the global supply shock has become. Source: Bloomberg.
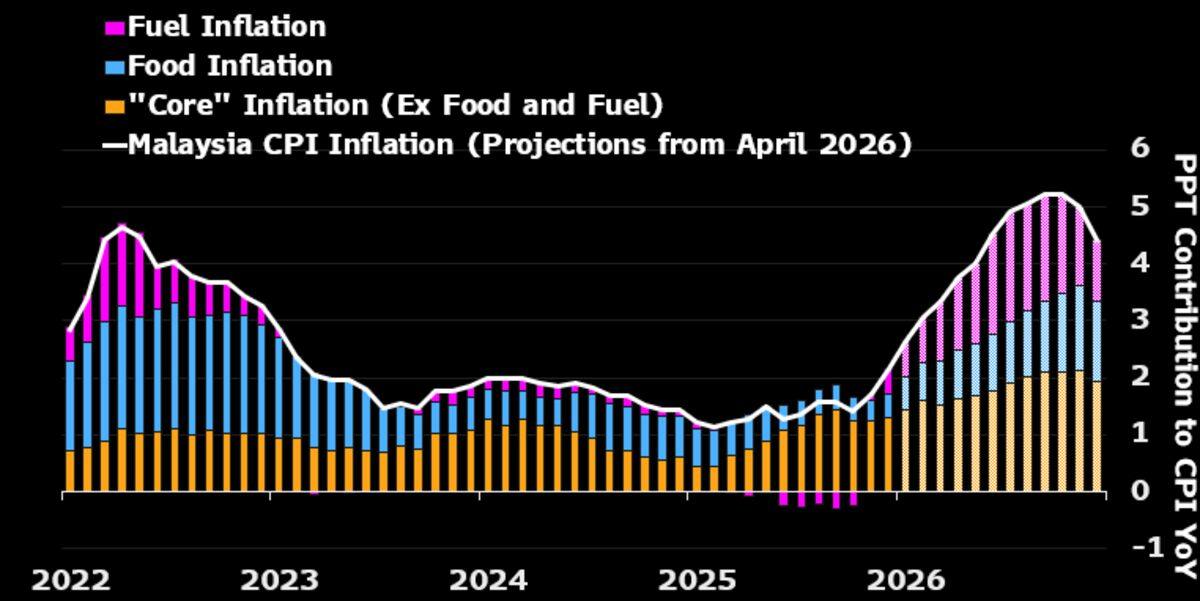
Malaysia's inflation outlook as the oil shock extends. Consumer prices likely rose 2.1% year-on-year in April, up from 1.7% in March. As an energy producer, higher global prices boost government oil revenues, providing scope to deflect the shock with subsidies. But the economy is not immune, food costs are climbing, and inflation is forecast to reach 5% before year-end. Government support has to be measured to keep fiscal risk in check. Source: Bloomberg.
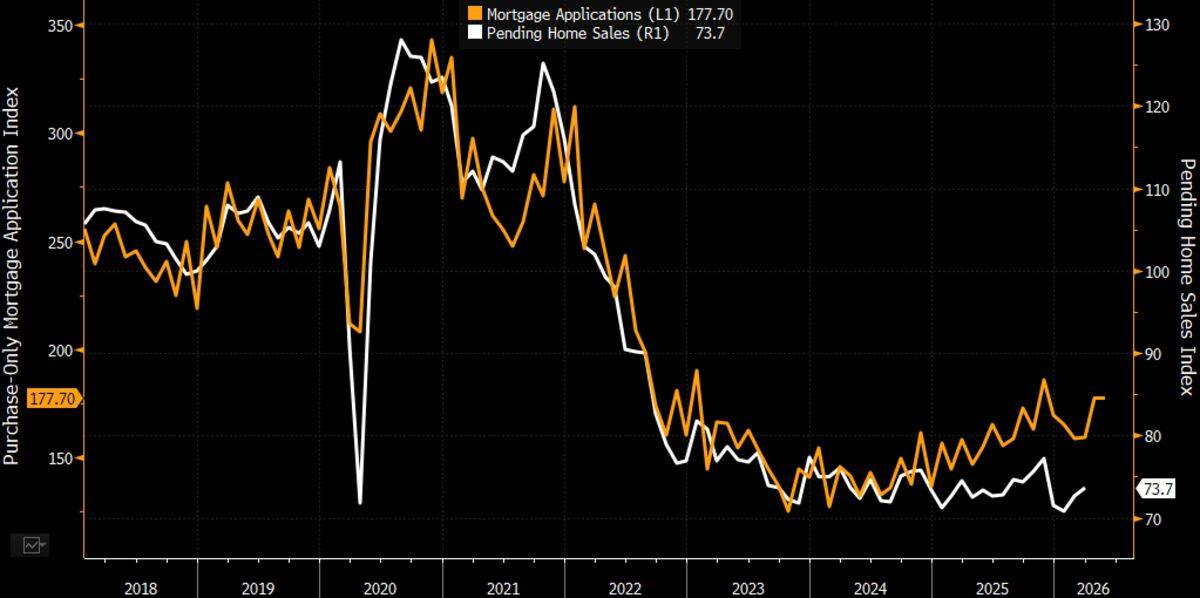
US contract signings point to rising home sales. Pending home sales likely increased 0.8% in April after March's 1.5% rise, mortgage applications pointing to an increase in contract signings at the start of spring. The catch is that the relationship between pending and existing sales has loosened amid elevated contract cancellations. Reports of cancellations and a near 20-basis-point increase in mortgage rates likely capped the gain. Source: Bloomberg.
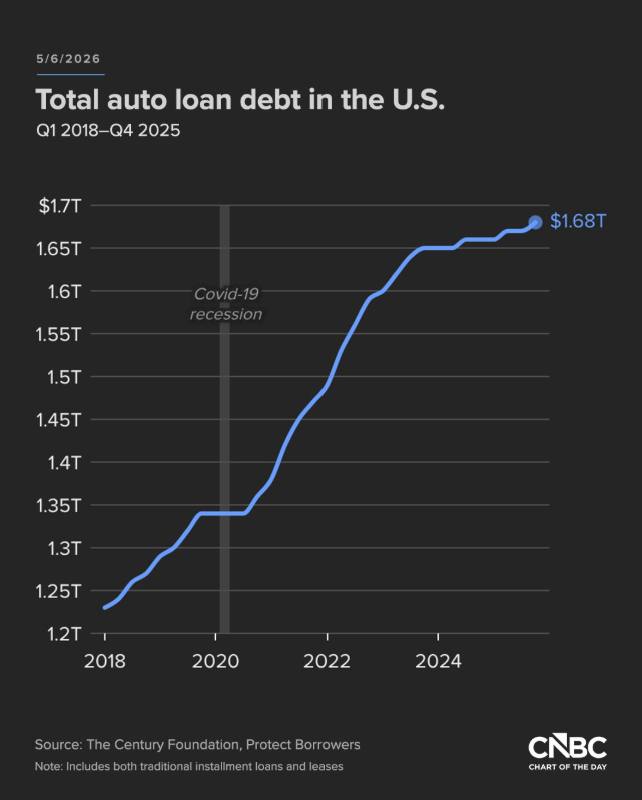
US auto debt is becoming a bigger problem for consumers. Total auto debt reached $1.68 trillion at the end of 2025, a 37% increase since late 2018. The figure sits underneath the record-low consumer sentiment and the retailers' caution, the slow accumulation of household strain that does not show up in a jobs print but does show up at the dealership and the dinner table. The consumer balance sheet is the channel a rate shock travels down. Source: CNBC.
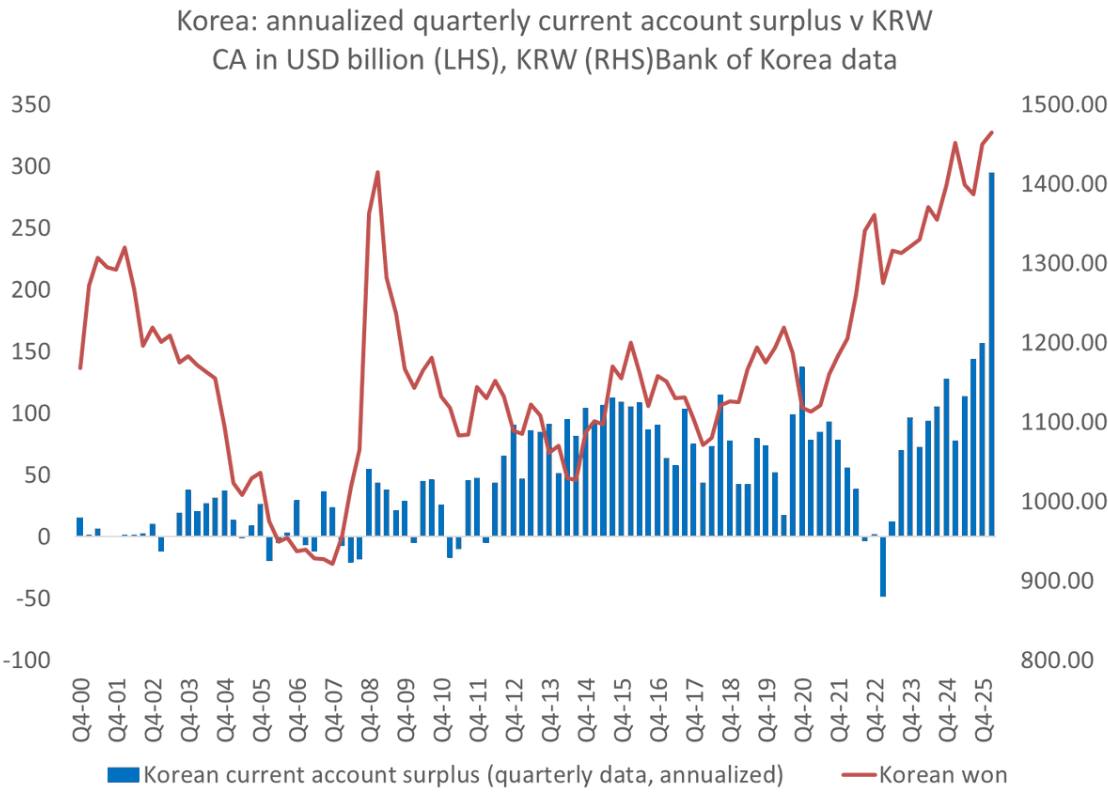
Two things one analyst never thought he would see, a $300 billion Korean current-account surplus, and that surplus paired with near-record won weakness against the dollar. It is the paradox of this regime. A textbook surplus economy should have a strong currency. Instead the won is weak, capital is flowing out faster than the trade surplus flows in, chasing US assets and US yields. Strange times, and a clean illustration of why the dollar is bid even against the world's strongest external balances. Source: Brad Setser.
Watershed Wednesday
The pivot. Nvidia earnings and the FOMC minutes land on the same afternoon, the AI bellwether into a stretched tape and the record of Powell’s last meeting expected to read hawkish. China holds its loan prime rates, Bank Indonesia its key rate, and UK CPI is the print that decides whether the gilt sell-off has more room. Size into this day, this is where the week is won or lost.
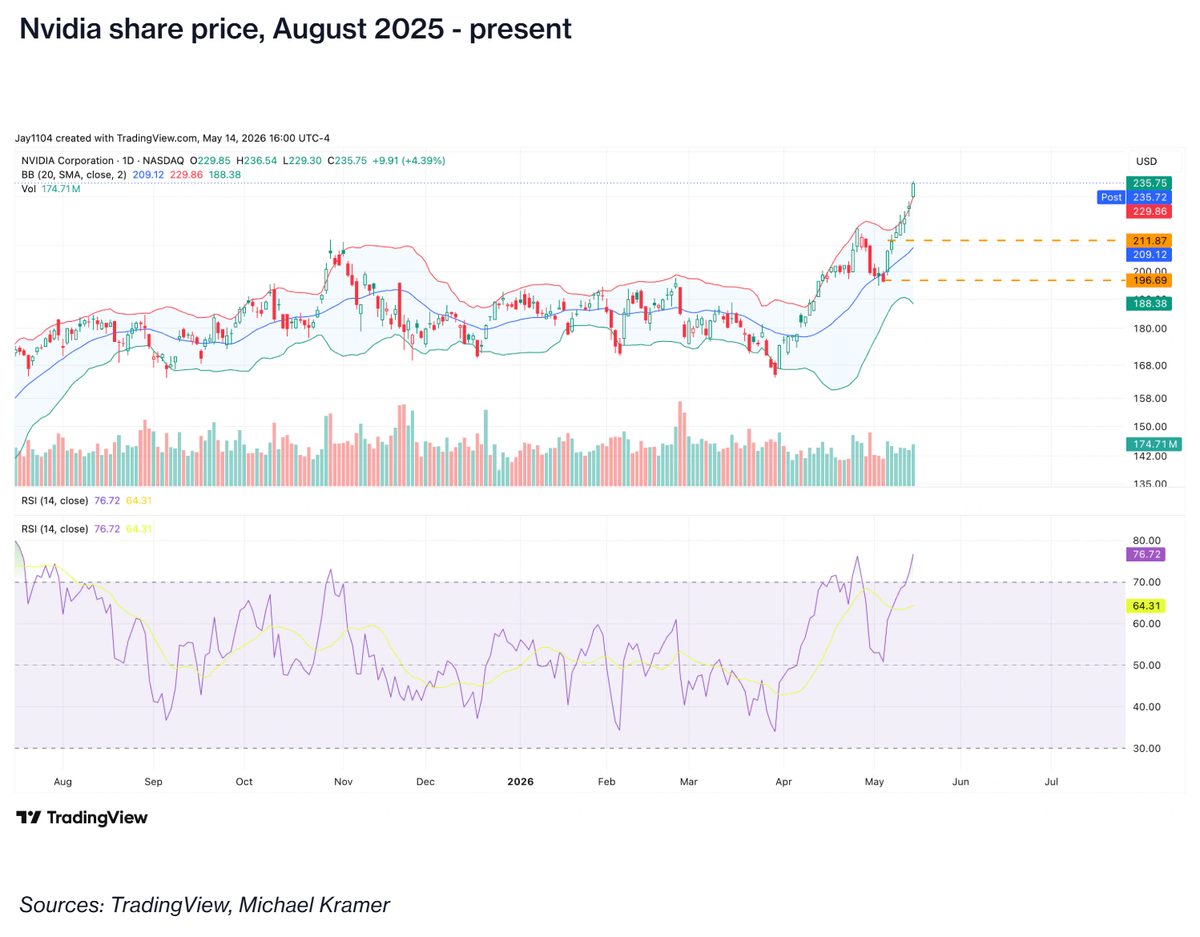
Nvidia goes into Wednesday's print already stretched. The chart sits near $235, riding well above its upper Bollinger Band, with RSI in the high seventies, deeply overbought. Revenue is expected at a record $79 billion, up 79%, the most in six quarters, and the call is for a beat-and-raise. The setup is asymmetric. A blowout is largely priced, a stumble is not, and the band cannot contain a move much further. The easy money is behind the chart. See the CMC Markets week ahead for the wider setup. Source: CMC Markets.
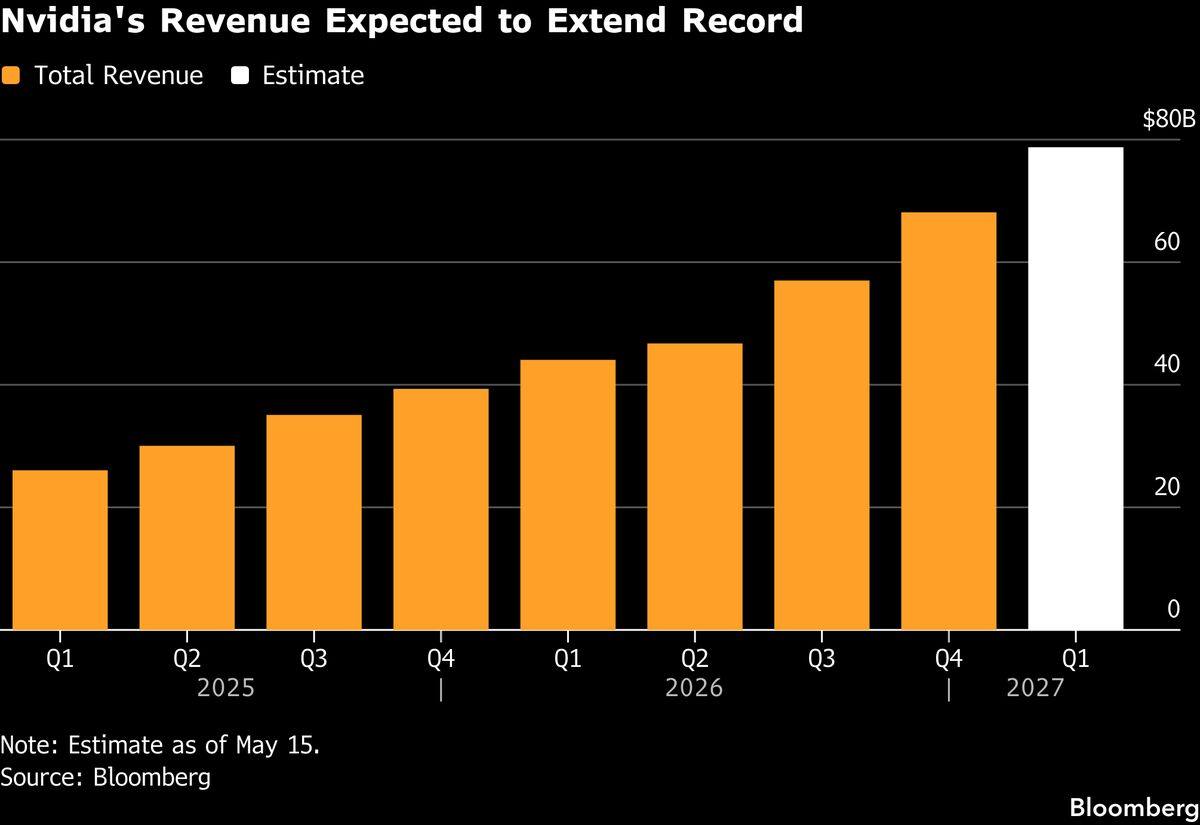
US earnings, the AI tape versus the consumer. Nvidia's result will either ease or reinforce concerns about an AI bubble as it nears a $6 trillion valuation. Alongside it, Walmart, Target, Home Depot and TJX report into a consumer squeezed by elevated gasoline prices. First-quarter S&P 500 earnings are tracking above 28% growth year-on-year. The split is the story, the AI complex compounding while the retailers stay cautious about the rest of the year. Source: Bloomberg.
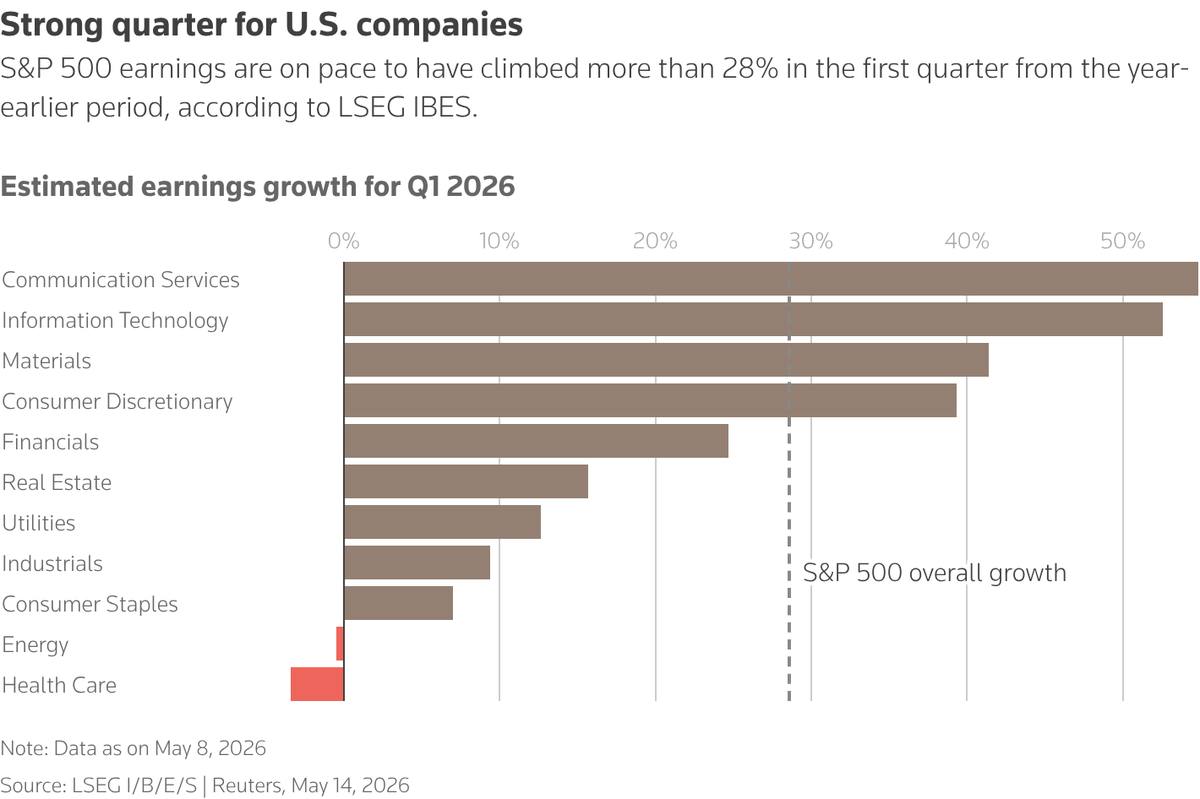
Estimated Q1 earnings growth by S&P 500 sector. A robust first-quarter season is ending with a bang, reports due from Nvidia and a host of retailers. With its chips at the centre of the AI build-out, Nvidia is the bellwether for the theme that has driven the bull market. Investors will read the retailers, Home Depot, Target, TJX, for signs that war-related price pressure is finally pinching consumer spending. Source: Reuters.
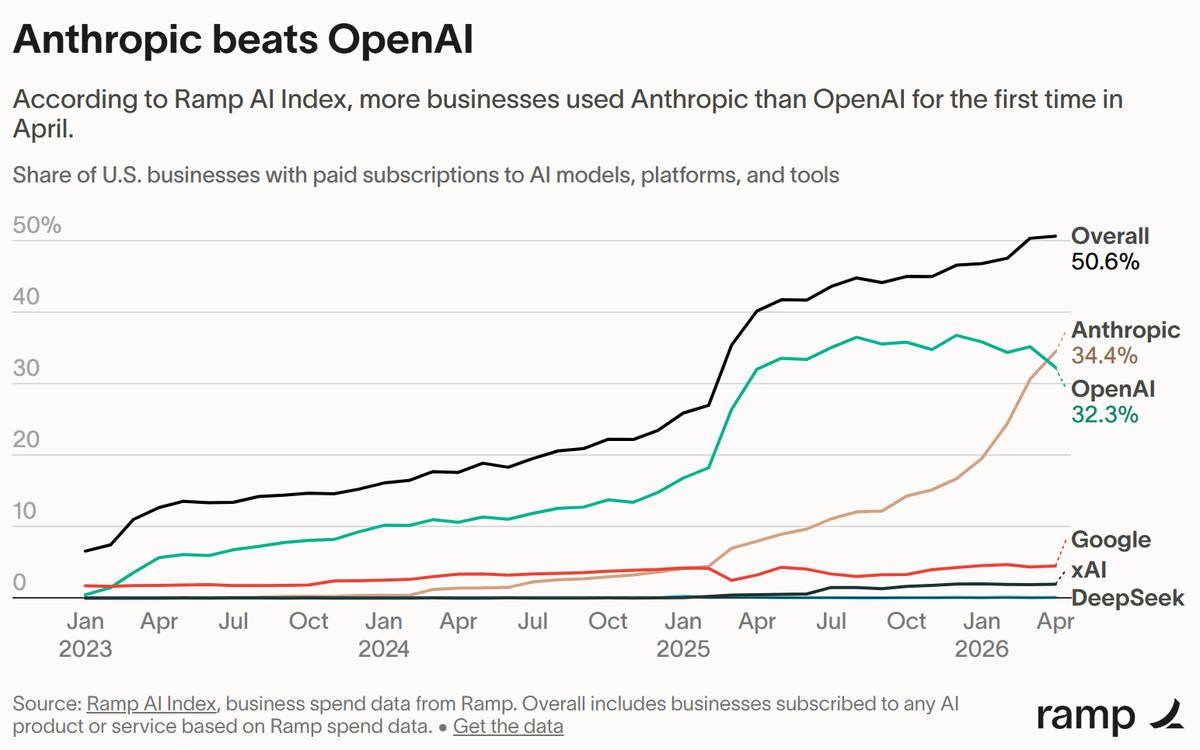
Anthropic, the headwinds behind the adoption numbers. One analysis flags three, that Anthropic earns more when businesses buy more tokens, an incentive misaligned with customers seeking to cut cost, that recent model changes triple token costs for any prompt with an image, and that compute strain has driven outages and rate limits. A SpaceX compute deal eases the immediate constraint. The deeper question for the whole AI complex is whether the unit economics work once the capex bill arrives. Source: Ramp AI Index.
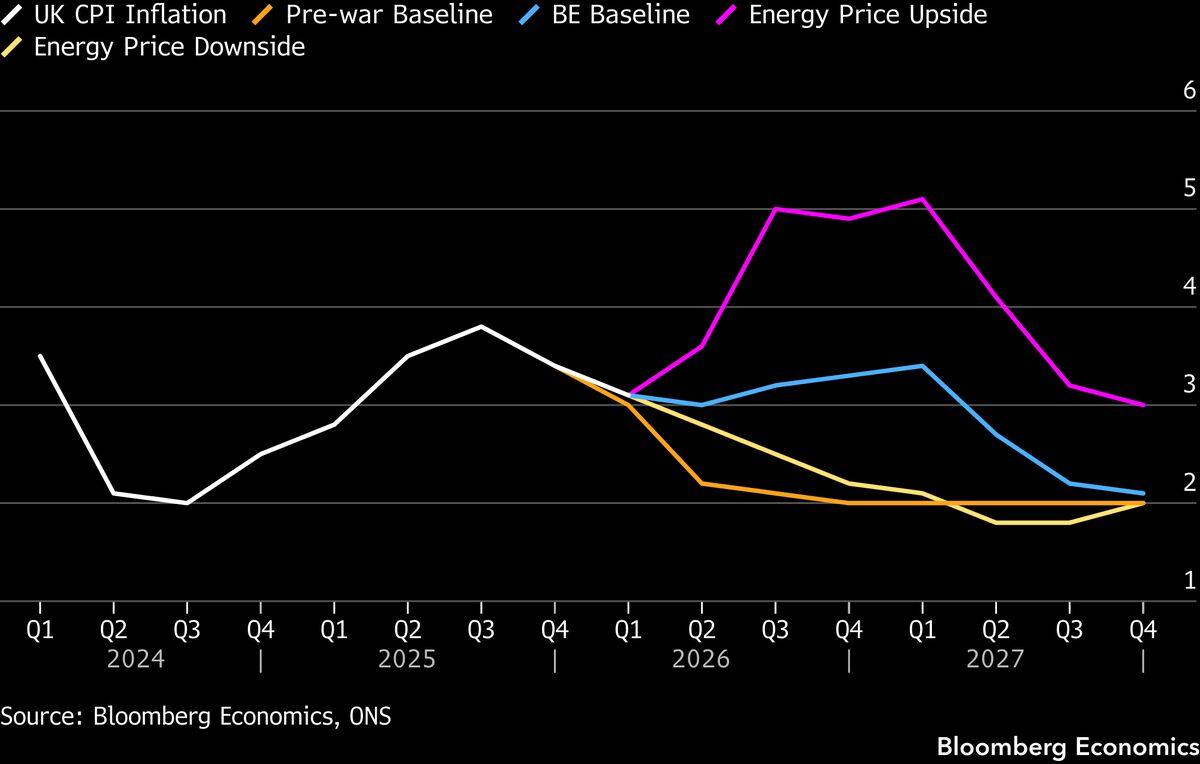
UK CPI likely to peak around the turn of the year. April inflation probably slowed to 3.1% year-on-year from 3.3%, helped by lower household energy bills and a favourable base effect in services. But the cooling is likely short-lived. Fuel prices, estimated up 15% this year, partly offset the disinflation, and inflation is expected to accelerate in coming months, peaking just shy of 3.5% around the turn of the year before falling back gradually. Source: Bloomberg.
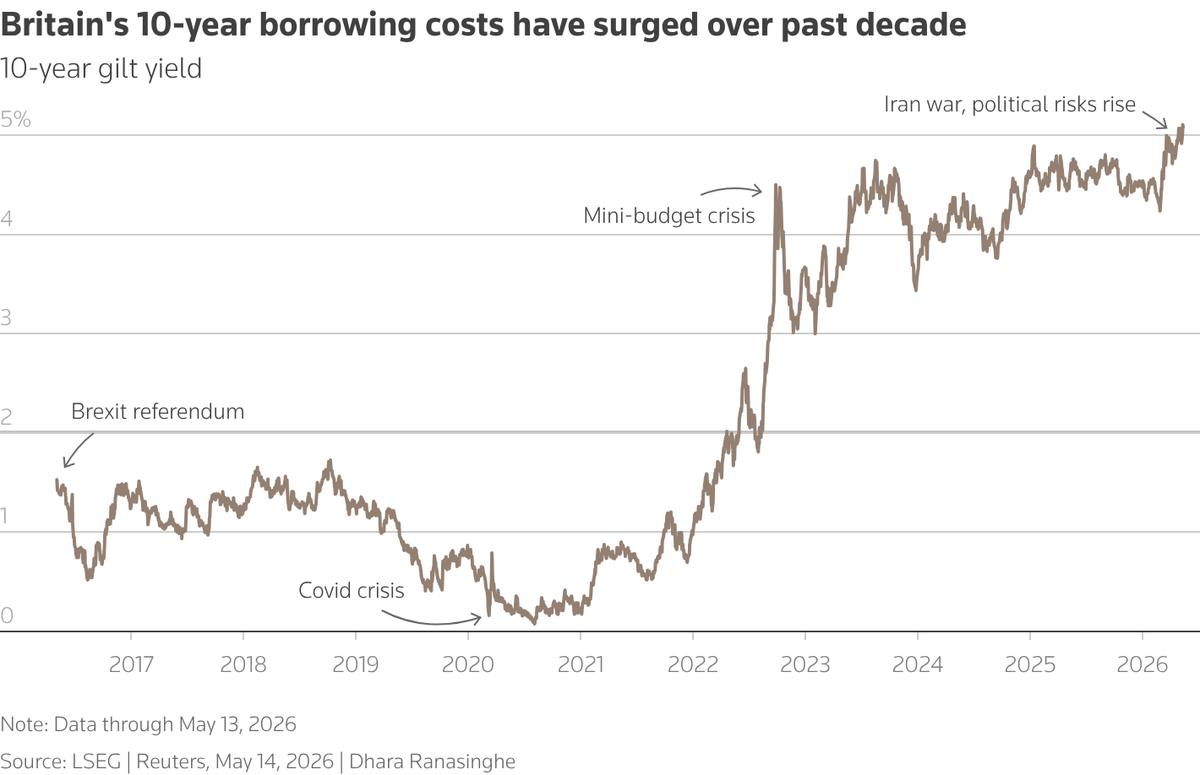
Britain's 10-year borrowing costs have surged over the past decade. UK 10-year gilt yields are near 18-year highs. The energy impact of the Iran war has wreaked havoc on global bonds, and domestic political uncertainty is not helping. The fear of a more left-leaning successor to the prime minister has stoked concern about Britain's fragile finances. If Wednesday's inflation print runs hot, the gilt sell-off has more room to run. Source: Reuters.
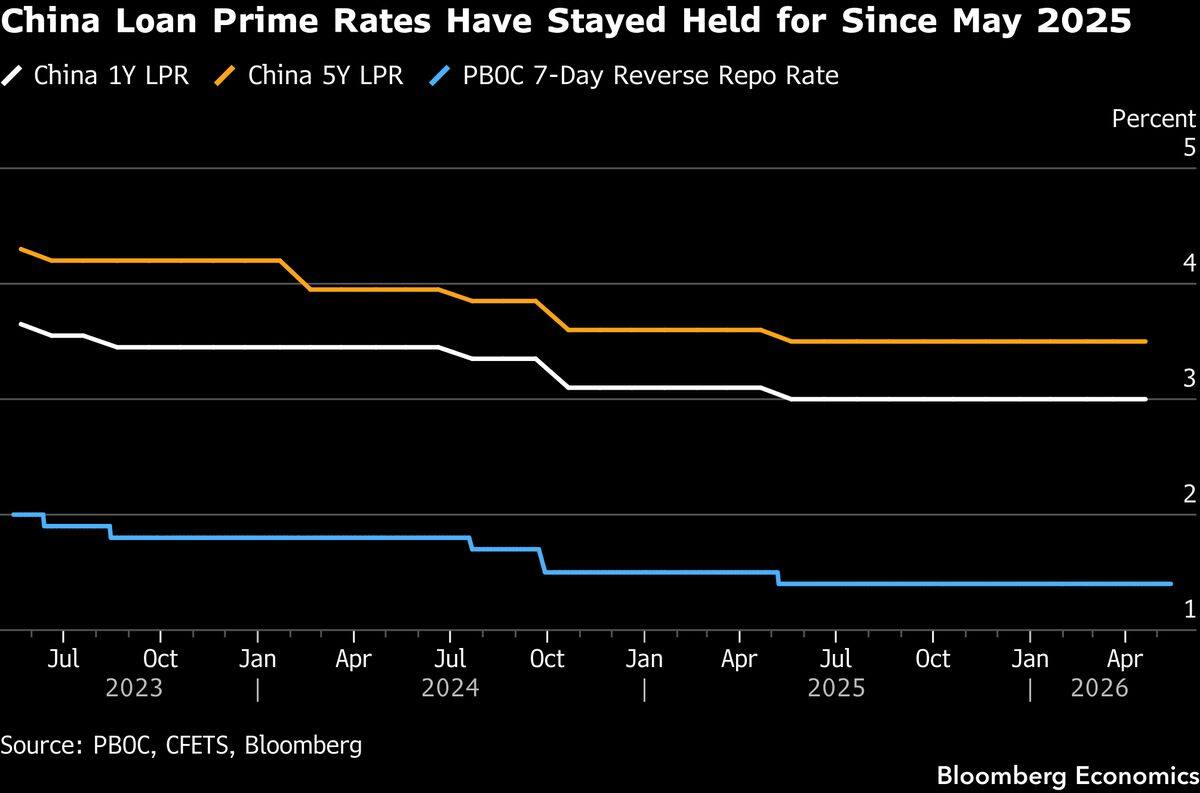
China's loan prime rates look set to stay on hold for a 12th month, the one-year reference for corporate loans at 3.00% and the five-year mortgage benchmark at 3.50%. The PBOC has been in a holding pattern since last May. It still has an easing tilt, but is not rushing, steady policy acts as an anchor against external uncertainty, and domestic liquidity is already ample. Beijing is leaning on fiscal policy, not new monetary easing. Source: Bloomberg.
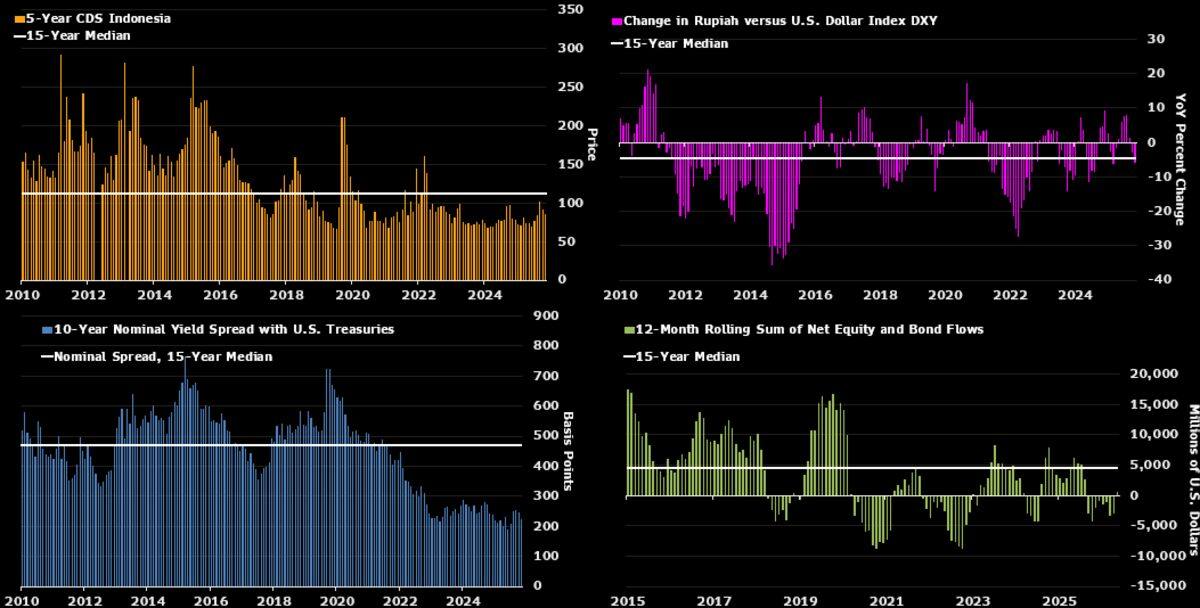
Indonesia's FX stability indicators are not yet signaling a hike. Bank Indonesia is likely to hold its key rate at 4.75%, the oil shock having yet to push inflation above the 1.5-3.5% target. The central bank expects seasonal rupiah pressure to subside and is content with smart interventions. Even so, it will likely pivot to hikes later this year if oil stays elevated and growth efforts bear fruit, pushing inflation above target. Source: Bloomberg.
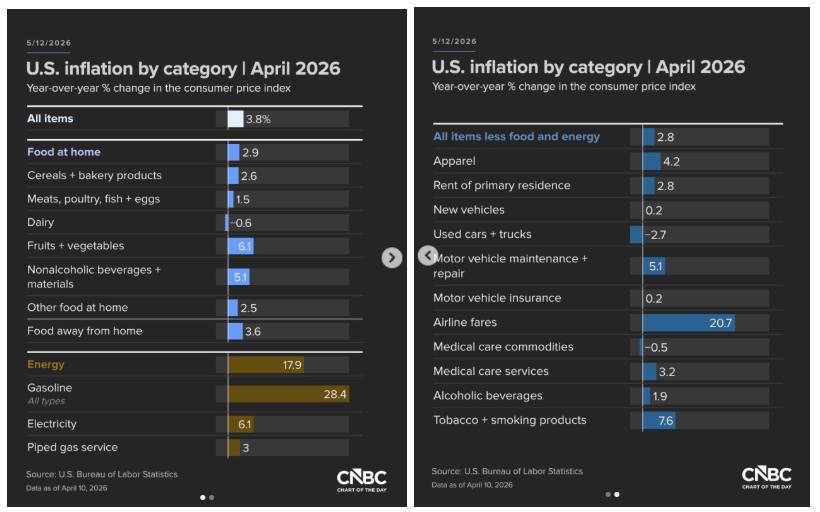
US inflation jumped in April to the highest in nearly three years. The consumer price index rose 3.8% from a year earlier, up from 3.3% in March, as surging gasoline prices fed through into a wide range of consumer goods. The April data is the clearer picture of the financial fallout for consumers after more than a month of conflict. It is also the print that has Wall Street thinking about rate hikes, and the FOMC minutes Wednesday will be read against it. Source: CNBC.
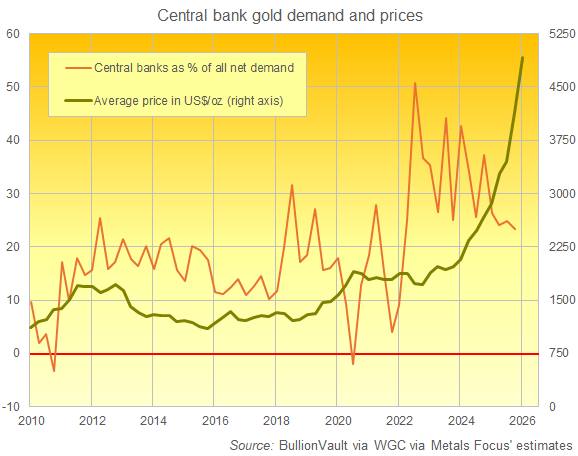
Gold erases its 2026 gains as central-bank selling hits the headlines. The chart prices gold against central-bank buying as a share of total net demand worldwide. Demand from central banks fell last year below 25% of net demand, down sharply from the prior three-year average of 33%. Russia has been selling since 2025 to fund the war in Ukraine, Turkey is mulling tapping its $135 billion in reserves to defend the lira. When the marginal central bank flips from buyer to seller, the structural bid that carried gold thins out. Source: BullionVault.
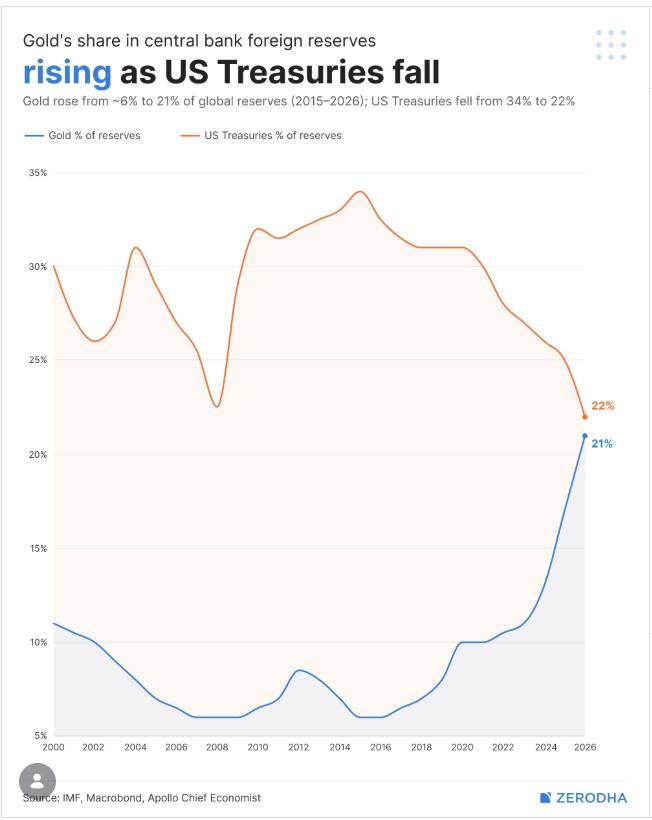
Central banks have been sending a signal since 2015, fewer dollars, more gold. The two lines, the dollar's share of global reserves and gold's, are almost touching now. It is the slow, decade-long diversification away from the dollar as a reserve asset, accelerated by the weaponization of finance after 2022. The question this year is whether energy-driven forced selling interrupts the trend, or whether it resumes once the war's pressure on currencies fades. Source: Markets by Zerodha.
TP Thursday
Take profit on the binaries that have run, hold position into the data. Walmart reports the smallest US same-store gain in two years. The euro-area flash PMI is the ECB’s dilemma in one number. Australia jobs, Philly Fed, jobless claims and housing starts round out a heavy macro slate, alongside the European Commission spring forecasts. Credit Weekly carries the BDC stress underneath it all. The second test of the week before Friday fades.
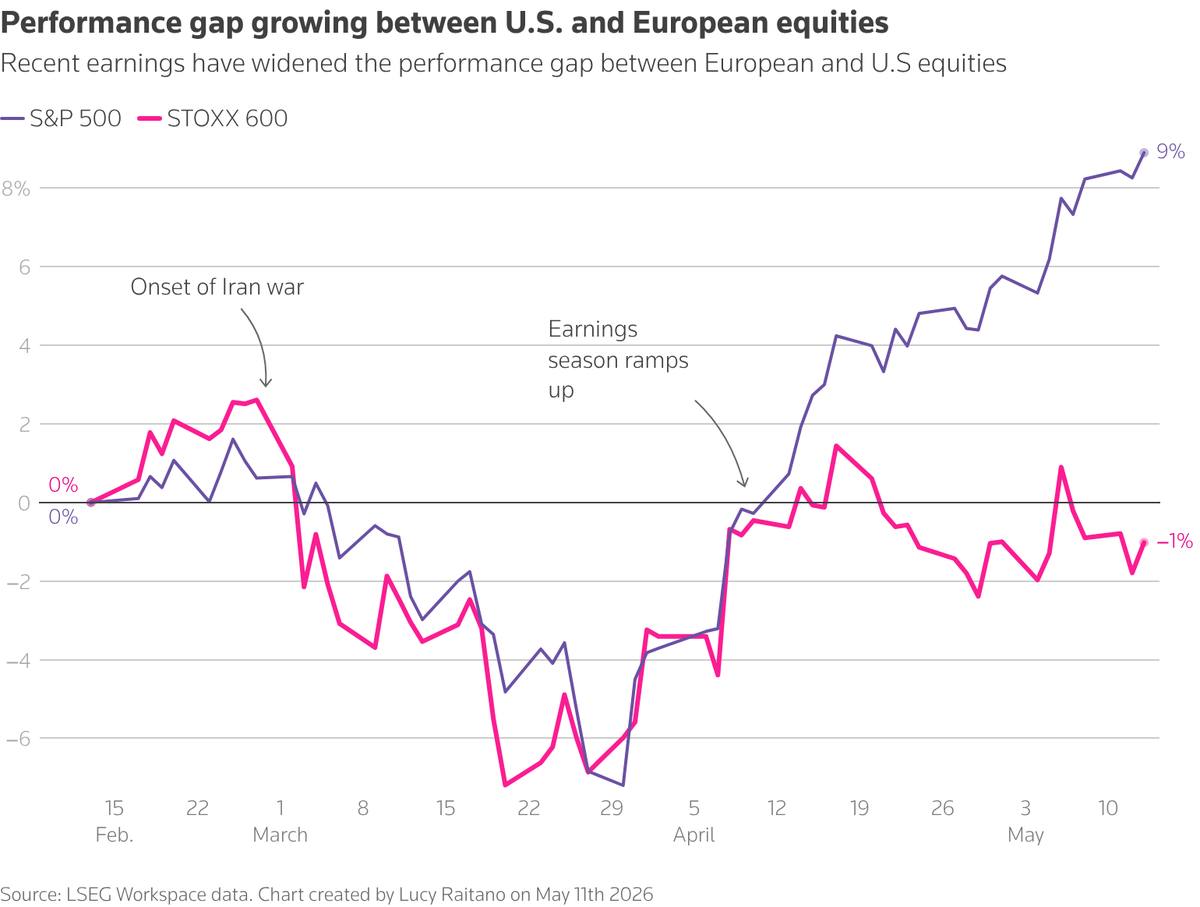
The performance gap between US and European equities keeps widening. The S&P 500 is up 8.8% this year against 3.3% for the STOXX 600. The divergence is starker still since the war began, the S&P rose 8.3% across March and April while the STOXX lost 3%. Europe's heavier reliance on energy imports has hit it harder, and a slate of robust US big-tech results against an increasingly weak European consumer is widening the split. Source: Reuters.
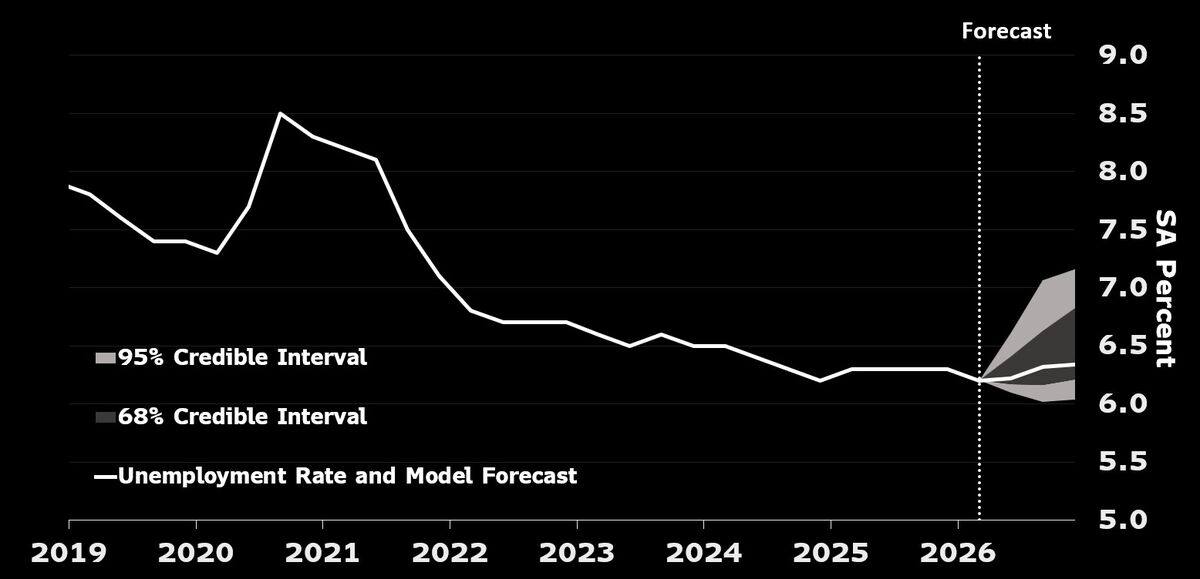
Euro-area unemployment risks skewed to the upside. The flash May PMI is the week's key release, after the survey showed a sharp slowdown in April, the headline dropping to 48.8 from 50.7. Q1 GDP grew just 0.1%. The war's commodity shock has created the ECB's dilemma, an economy weakening markedly as inflation climbs. A June hike is still the base case, but the risk is the Governing Council chooses to look through near-term price pressure. Source: Bloomberg.
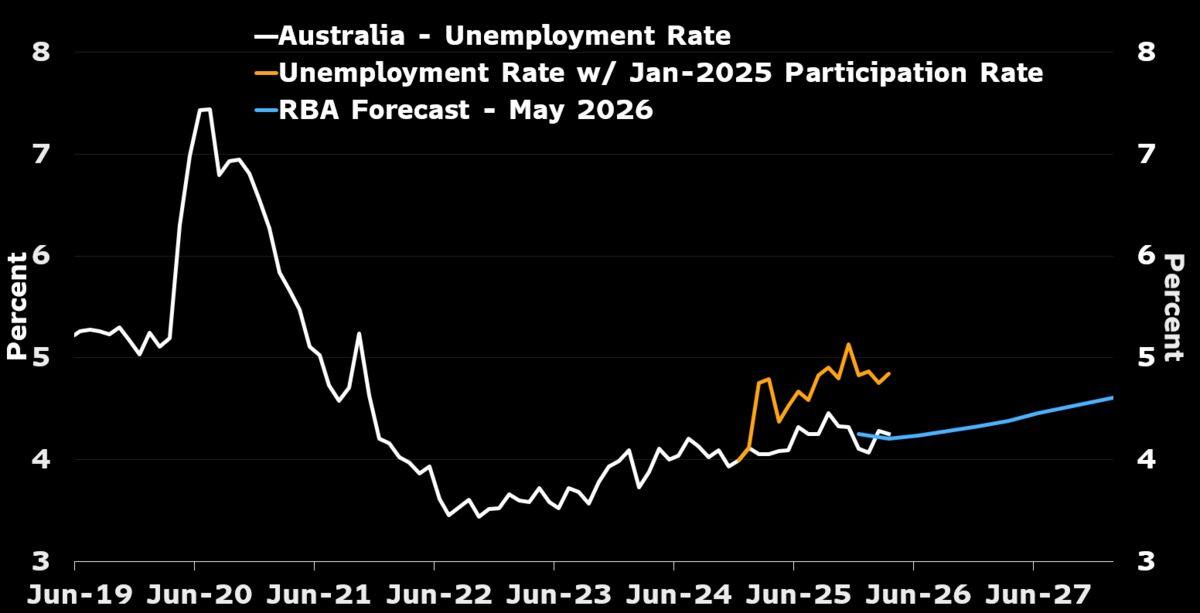
Australia's participation slump has masked a slowdown in job growth. The April labour report likely shows modest 15k job growth and an unemployment rate rising to 4.4%, as labour supply outpaces hiring. Around 32k new jobs a month are needed just to hold the rate steady. Job growth slowed through 2025 after strong 2024 gains, and the Iran war's confidence shock should slow hiring further through 2026. Source: Bloomberg.
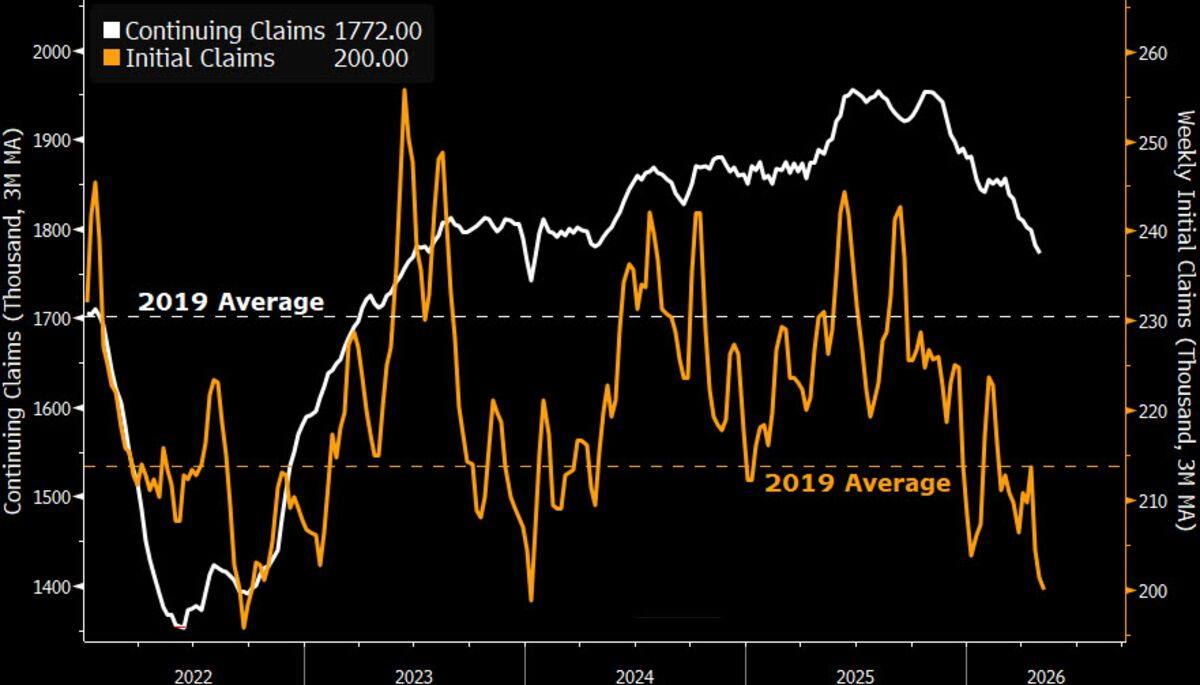
Low initial claims cap the upside in continuing claims. US jobless claims have run below year-earlier levels for fourteen straight weeks, with claims in the Midwest and South notably lower than last year. The low level keeps the insured unemployment rate near 1.2%. While AI tops the list of stated reasons for job cuts, layoffs have stayed broadly subdued. The hard data still reassures, even as the inflation data does not. Source: Bloomberg.
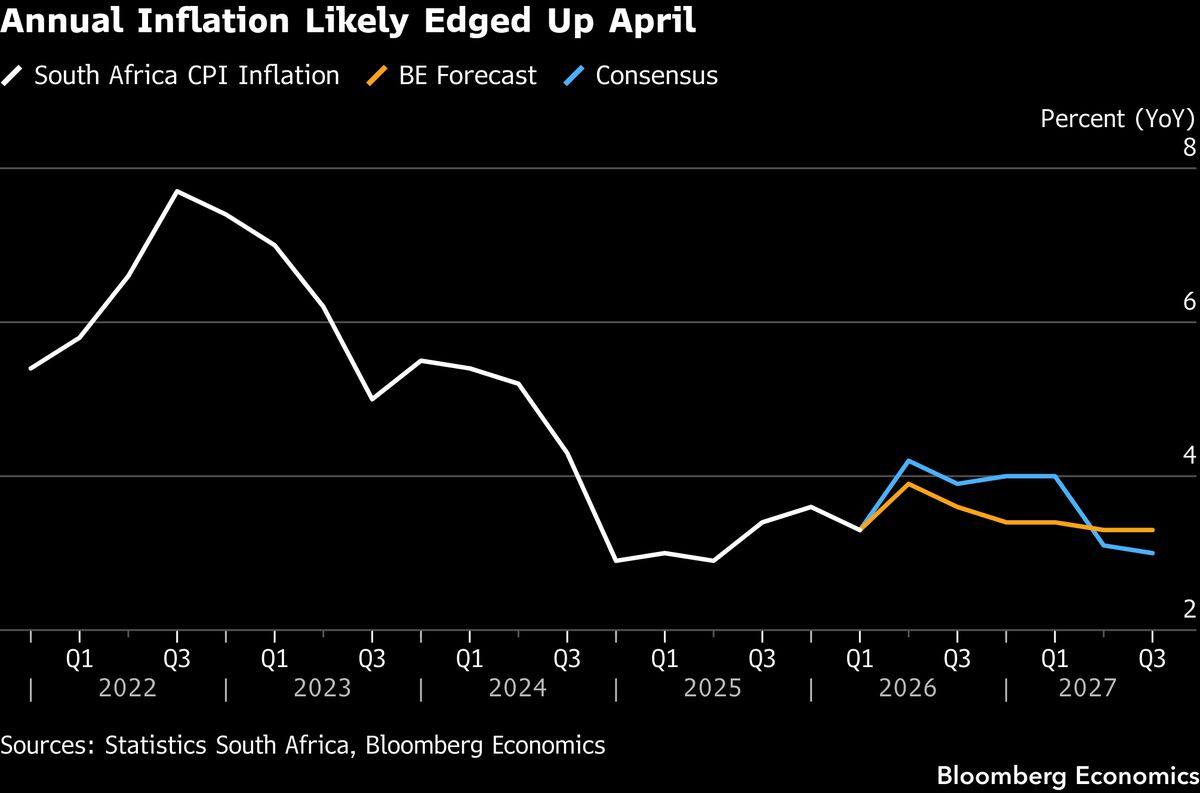
South Africa's April CPI likely shows the first pass-through from the war-driven oil shock, inflation rising to 3.5% year-on-year from 3.1%. Transport costs jumped in April, pushing the year-on-year rate positive for the first time this year. Inflation should keep climbing through 2Q toward the upper bound of the tolerance band. The path in the second half depends on how persistent oil prices prove. Source: Bloomberg.
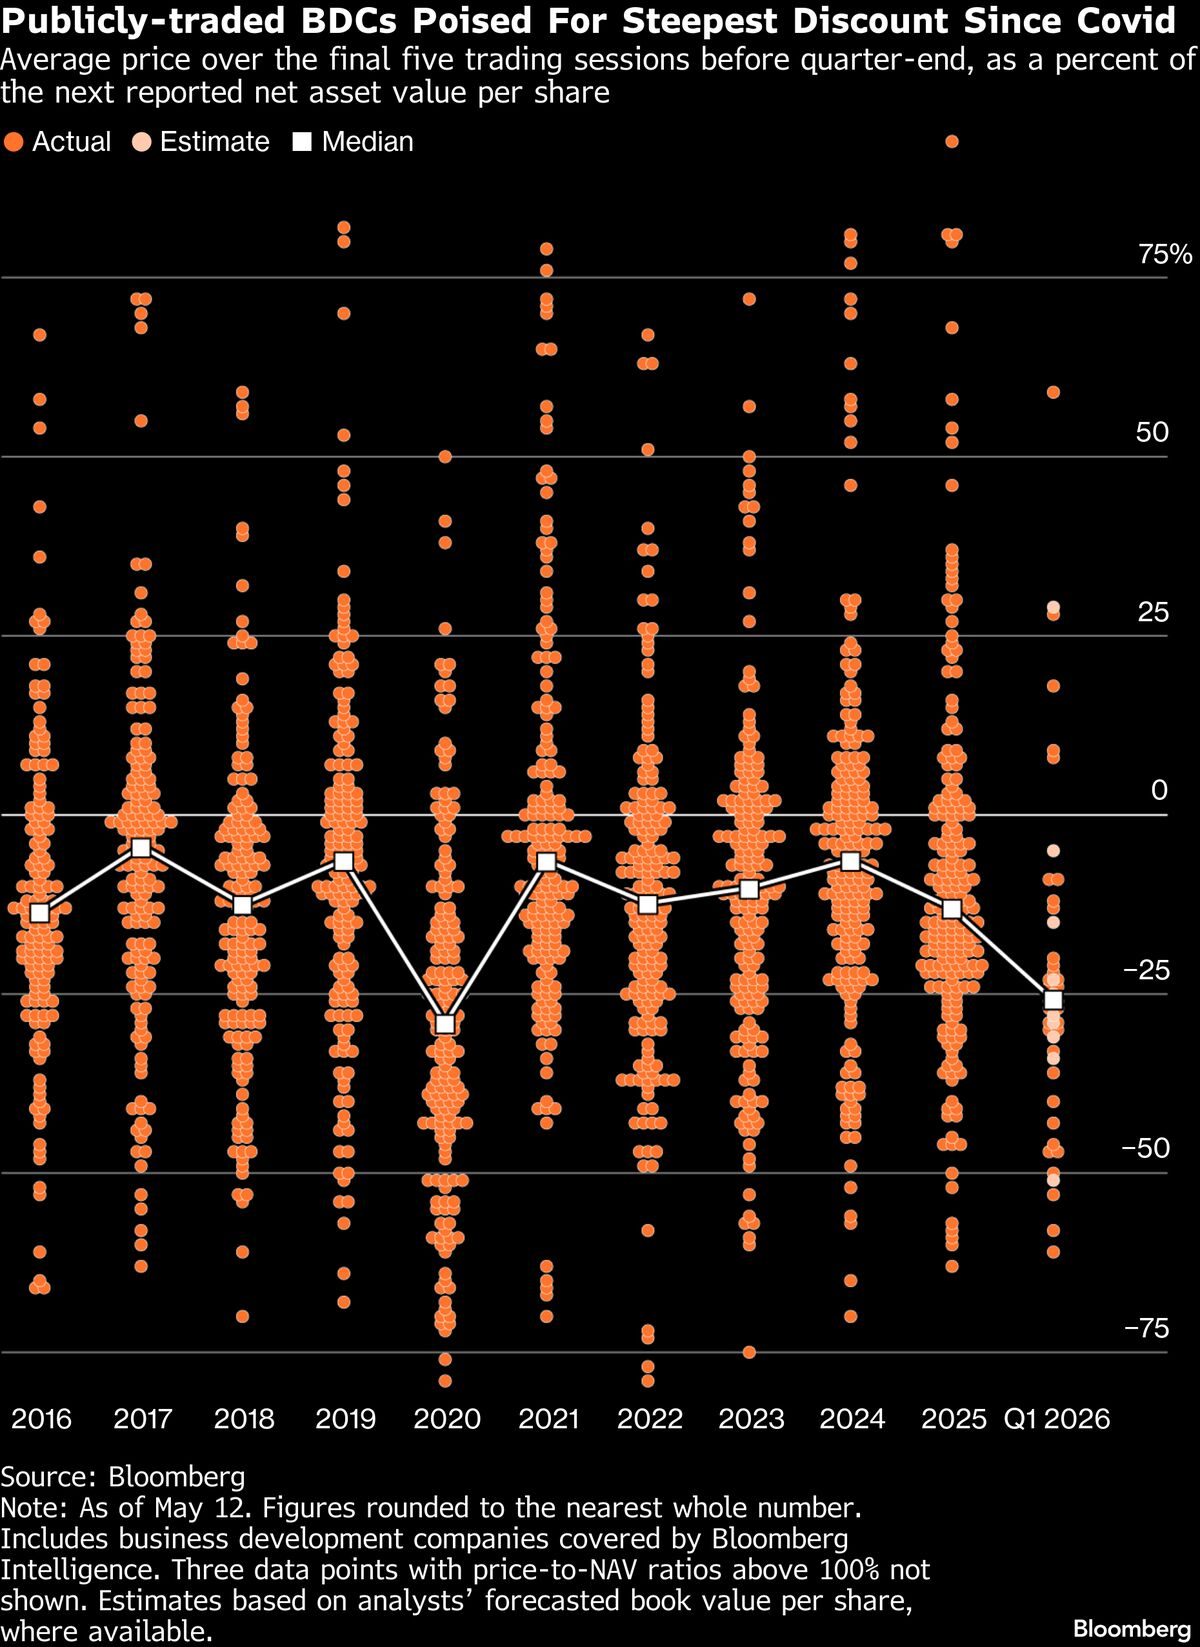
Public BDCs are poised for their steepest discount to net asset value since Covid. The swarm plots every Bloomberg-covered business development company at its price over the five sessions before quarter-end, as a percent of the next reported NAV. The Q1 2026 median has dropped to roughly 15% below NAV, the widest since 2020. FS KKR and Carlyle cut dividends, Blue Owl and Sixth Street posted quarterly losses, and non-traded private credit funds saw redemptions exceed inflows for the first time. The retail money that was the industry growth engine is now the channel through which public-market volatility reaches private credit. Source: Bloomberg Credit Weekly.
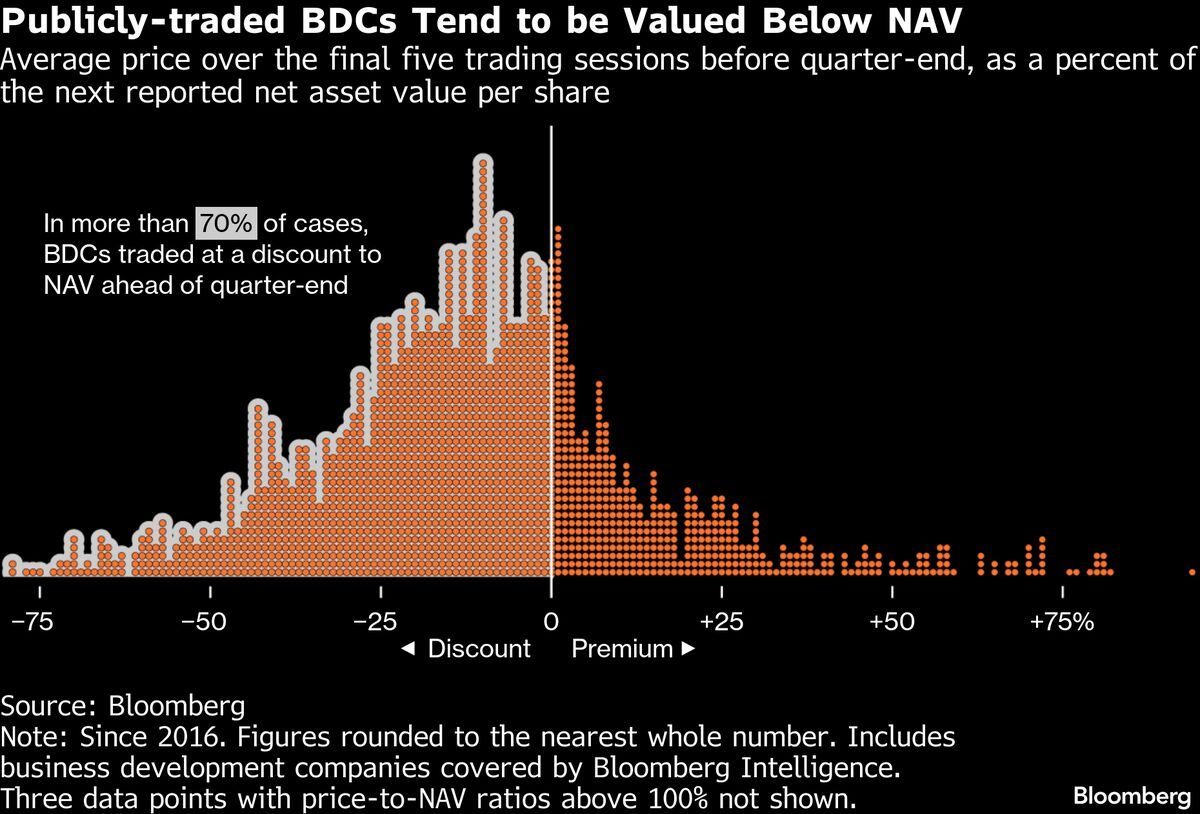
BDCs trade below NAV most of the time, but rarely this far below. Since 2016, in more than 70% of cases public BDCs were valued at a discount ahead of quarter-end, the histogram mass sitting left of zero. A modest discount is the resting state of the sector. What is new is the shift into the deep-discount tail, where the market stops pricing a structural quirk and starts pricing credit losses. Citi flags the divergence between manager rhetoric, that the selloff is an opportunity, and the hedges the sophisticated money is quietly putting on. Source: Bloomberg Credit Weekly.
Friday Fade
By design lighter, liquidity sizzling into the weekend. Japan April CPI keeps the BOJ on a June-hike path. Germany Ifo, last at its lowest since 2020. UMich final confirms the record-low sentiment. Mexico GDP. Waller speaks in Frankfurt. Clear the desk before the weekend, but glance over the fence first. The week of May 25 opens quiet, US Memorial Day and the UK spring bank holiday shut markets on Monday the 25th, then builds to a real test on Friday the 29th, when US April PCE either confirms or breaks the CPI and PPI heat that drove this week. In between, US durable goods and Conference Board confidence on the 26th, the second Q1 GDP estimate and jobless claims on the 28th, Tokyo May CPI and the euro-area flash CPI into Friday, and China’s official PMIs on the 31st. Month-end rebalancing flows and the post-Nvidia tape set the tone. The OPEC+ ministerial without the UAE lands late in the month. Go into next weekend already knowing the 29th is the next pivot.
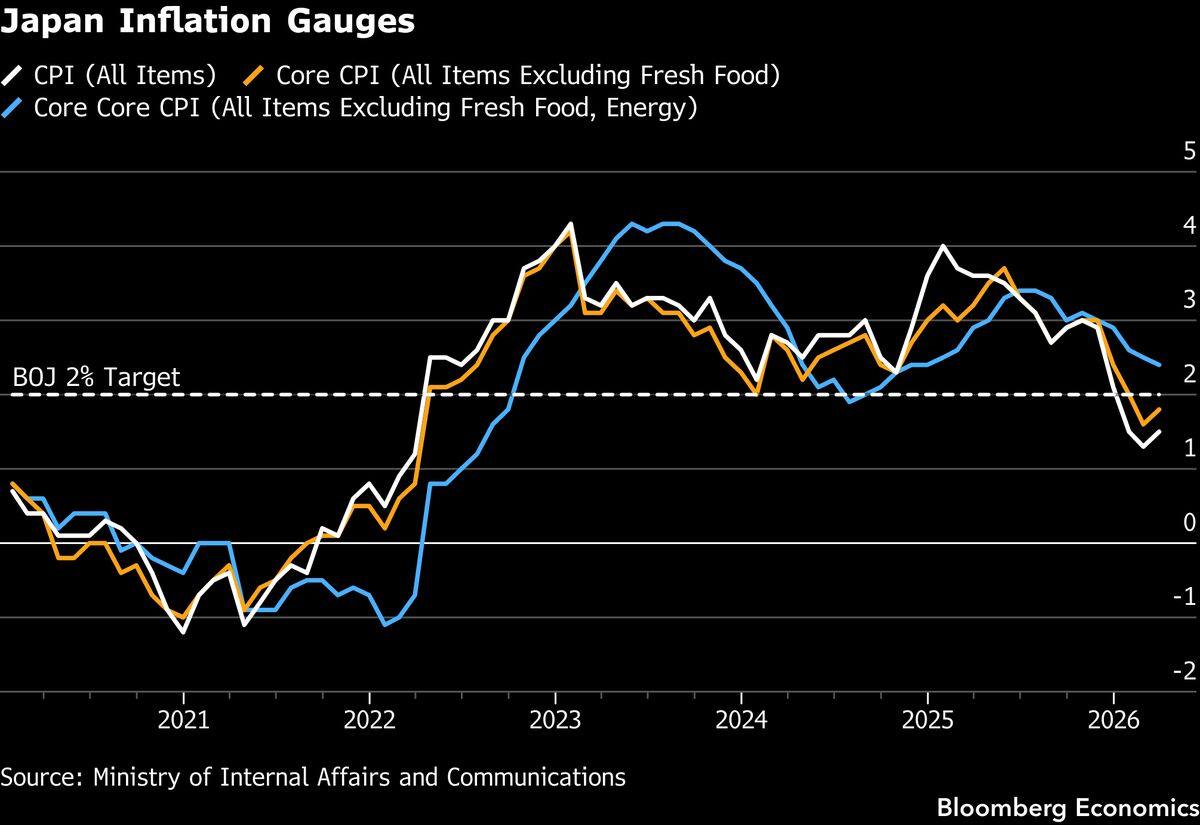
Japan's April CPI is likely to show headline inflation firm at 1.7% year-on-year, up from 1.5% in March, the core gauge holding at 1.8%. Firms are passing on higher labour costs and import prices from a weak yen, with railway fares and cigarette taxes adding pressure. The report keeps the Bank of Japan focused on withdrawing stimulus, paving the way for a 25-basis-point hike to 1.0%, likely in June. Source: Bloomberg.
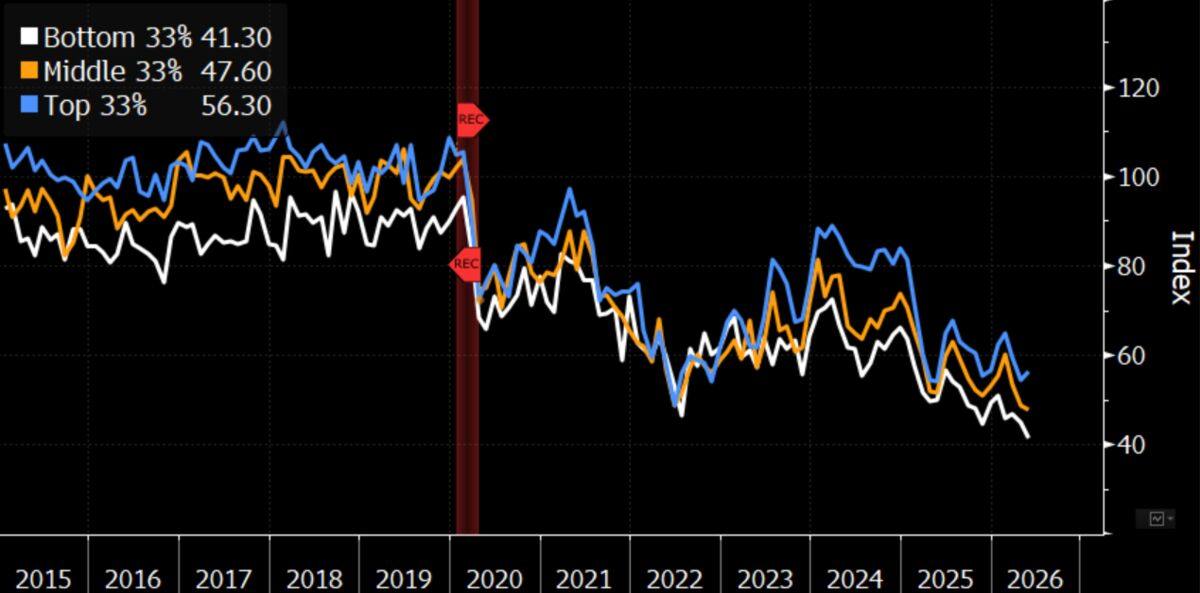
US consumer sentiment diverges across income groups. The University of Michigan final May reading is expected to confirm the preliminary record low of 48.2, down from 49.8 in April. Inflation expectations eased slightly in the preliminary survey, but overall sentiment reflects persistent strain from elevated prices, and the impact is highly uneven. The wealthy hold up, the rest do not. The headline number hides two economies. Source: Bloomberg.
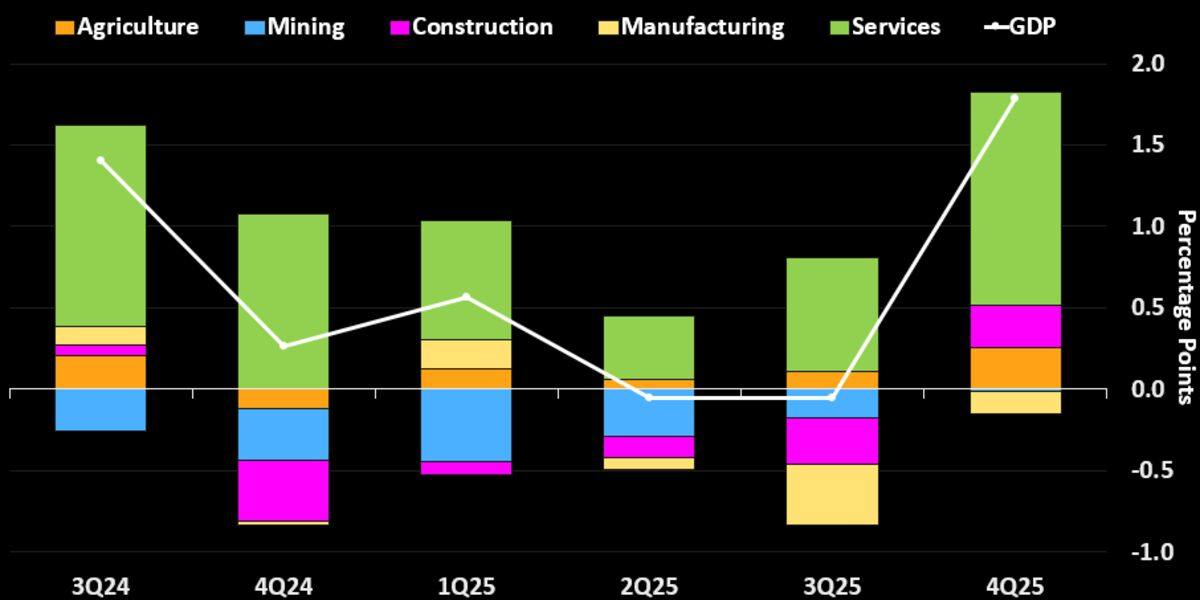
Mexico's economy is operating below potential. GDP growth likely held at just 0.1% year-on-year in the final 1Q estimate, below Banxico's forecast, a wider negative output gap than policymakers anticipated. Industrial production fell 1.2% year-on-year, manufacturing dragged by tariffs and trade uncertainty. Low unemployment and rising wages still support domestic demand, but higher oil prices are an added headwind. Source: Bloomberg.
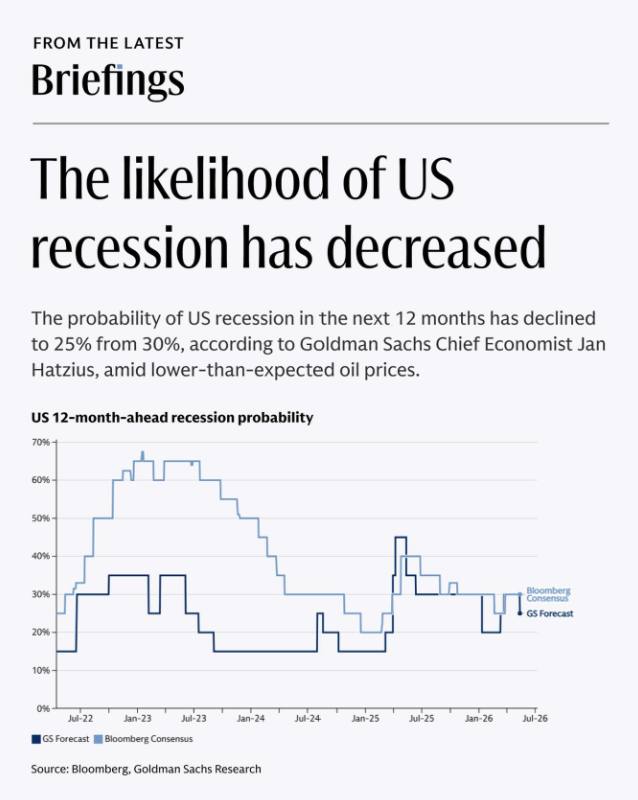
Goldman has lowered its US recession probability. Despite the possibility of adverse outcomes from the Iran conflict, US economic activity has stayed strong and oil prices have not risen as much as feared. It is the bull case in one line, the hard data keeps reassuring even as the inflation data and the bond market do not. The risk is that a recession call cut today is the contrarian indicator tomorrow, the soft data has been screaming while the hard data whispers. Source: Goldman Sachs.
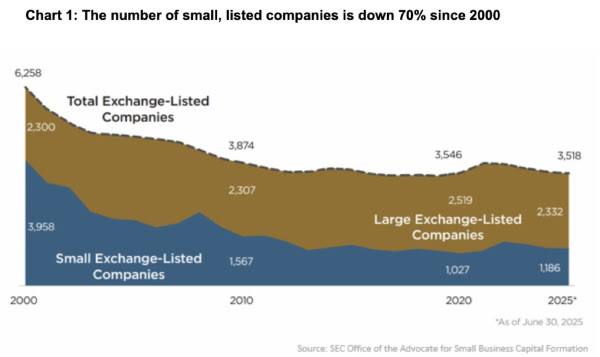
The number of small listed companies is down 70% since 2000. The total count of publicly listed companies has nearly halved, and for small-caps it has shrunk by 70%. The driver is the rise of private capital, private equity assets under management have more than doubled since 2018, letting fast-growing companies stay private. Rising compliance costs discourage IPOs. Cerebras and SpaceX listing this quarter are the exceptions that prove the rule, the public market is shrinking even as the private one swells. Source: Daily Chartbook.
VC+ Special Dispatch — The U.S.-China Relationship
The summit produced framing, not substance, so this dispatch maps the rivalry the summit could not resolve. Nine charts on the structural balance of power. Ray Dalio’s Great Powers Index scores the two head to head. Then the manufacturing gap, the trade-hub map, the bilateral network and what each side sells the other, the import-dependency league table, two decades of Chinese capital going global, and the two charts that matter most for supply chains, China’s lock on critical-metal mining and its near-monopoly on refining.
How Two Superpowers Stack Up — Dalio's Great Powers Index
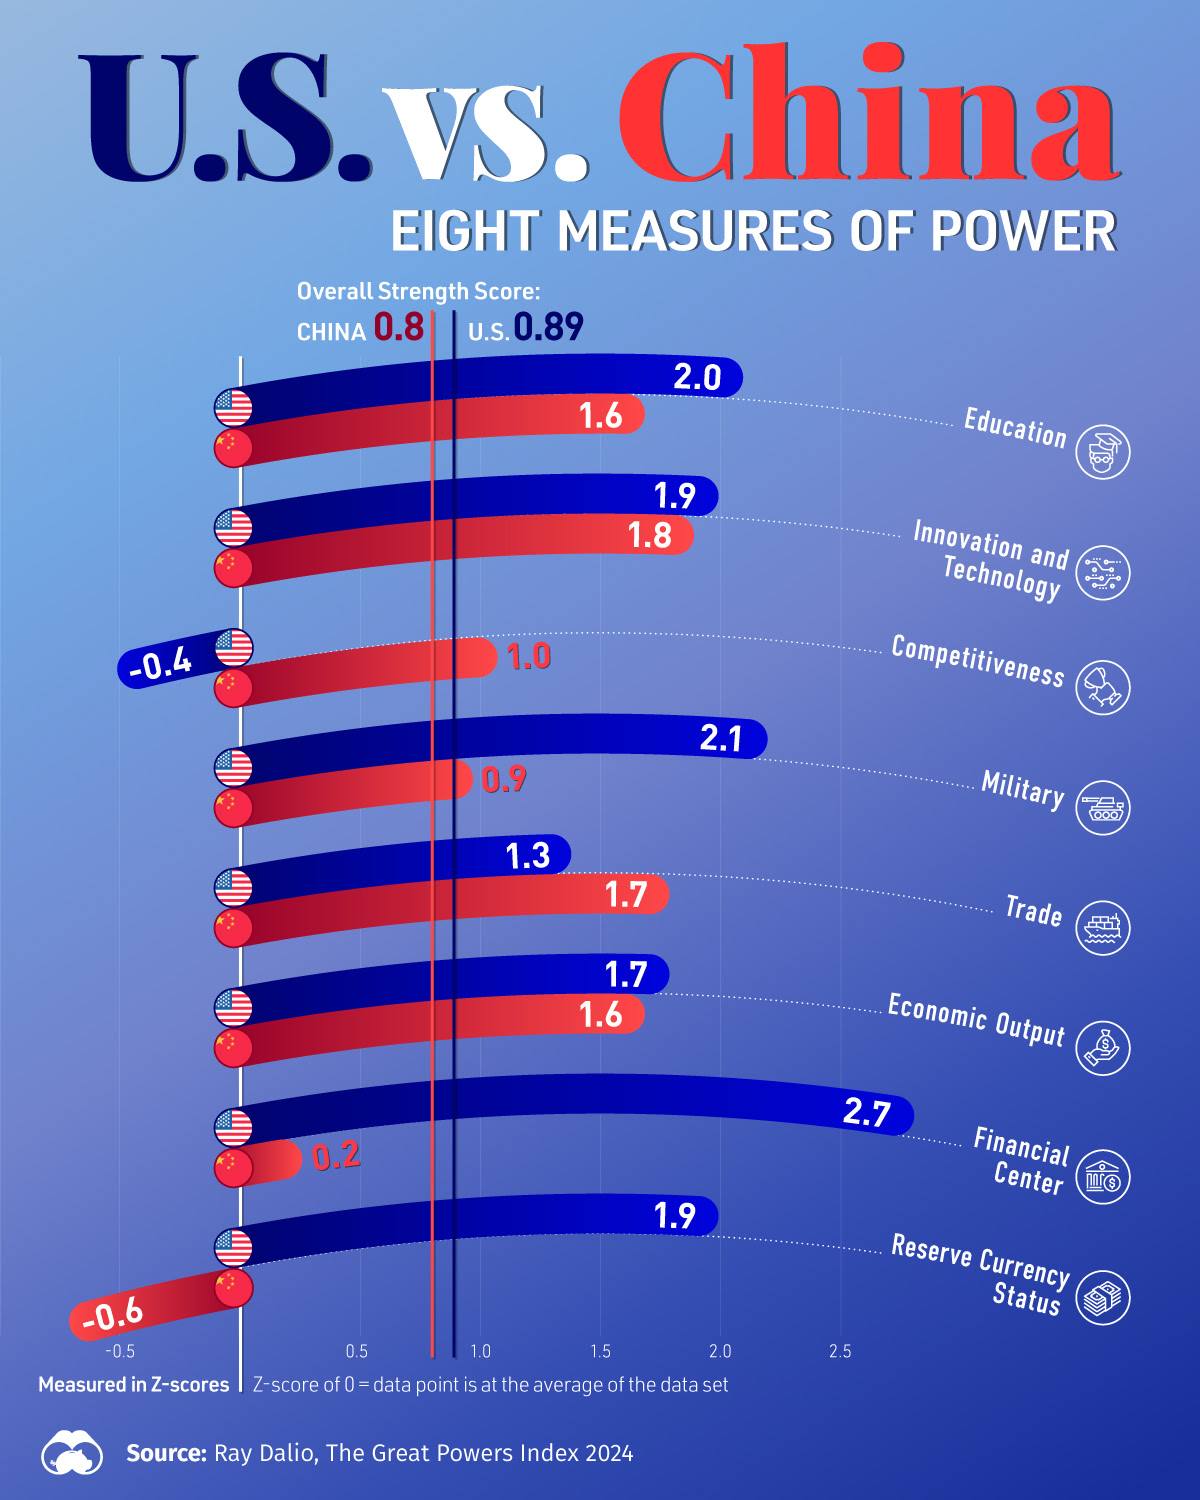
How two superpowers stack up. Ray Dalio's Great Powers Index scores both countries across eight dimensions, from education and innovation to military strength and reserve-currency status. The composite is tight, the US edging China 0.89 to 0.80. But the headline hides asymmetric strengths. The widest gaps sit at the bottom, the US scoring 2.7 on financial-centre status and 1.9 on reserve currency against 0.2 and -0.6 for China. That gap is the structural reason Washington still sets the global price of capital. Source: Visual Capitalist.
China's Factories Pulled Ahead
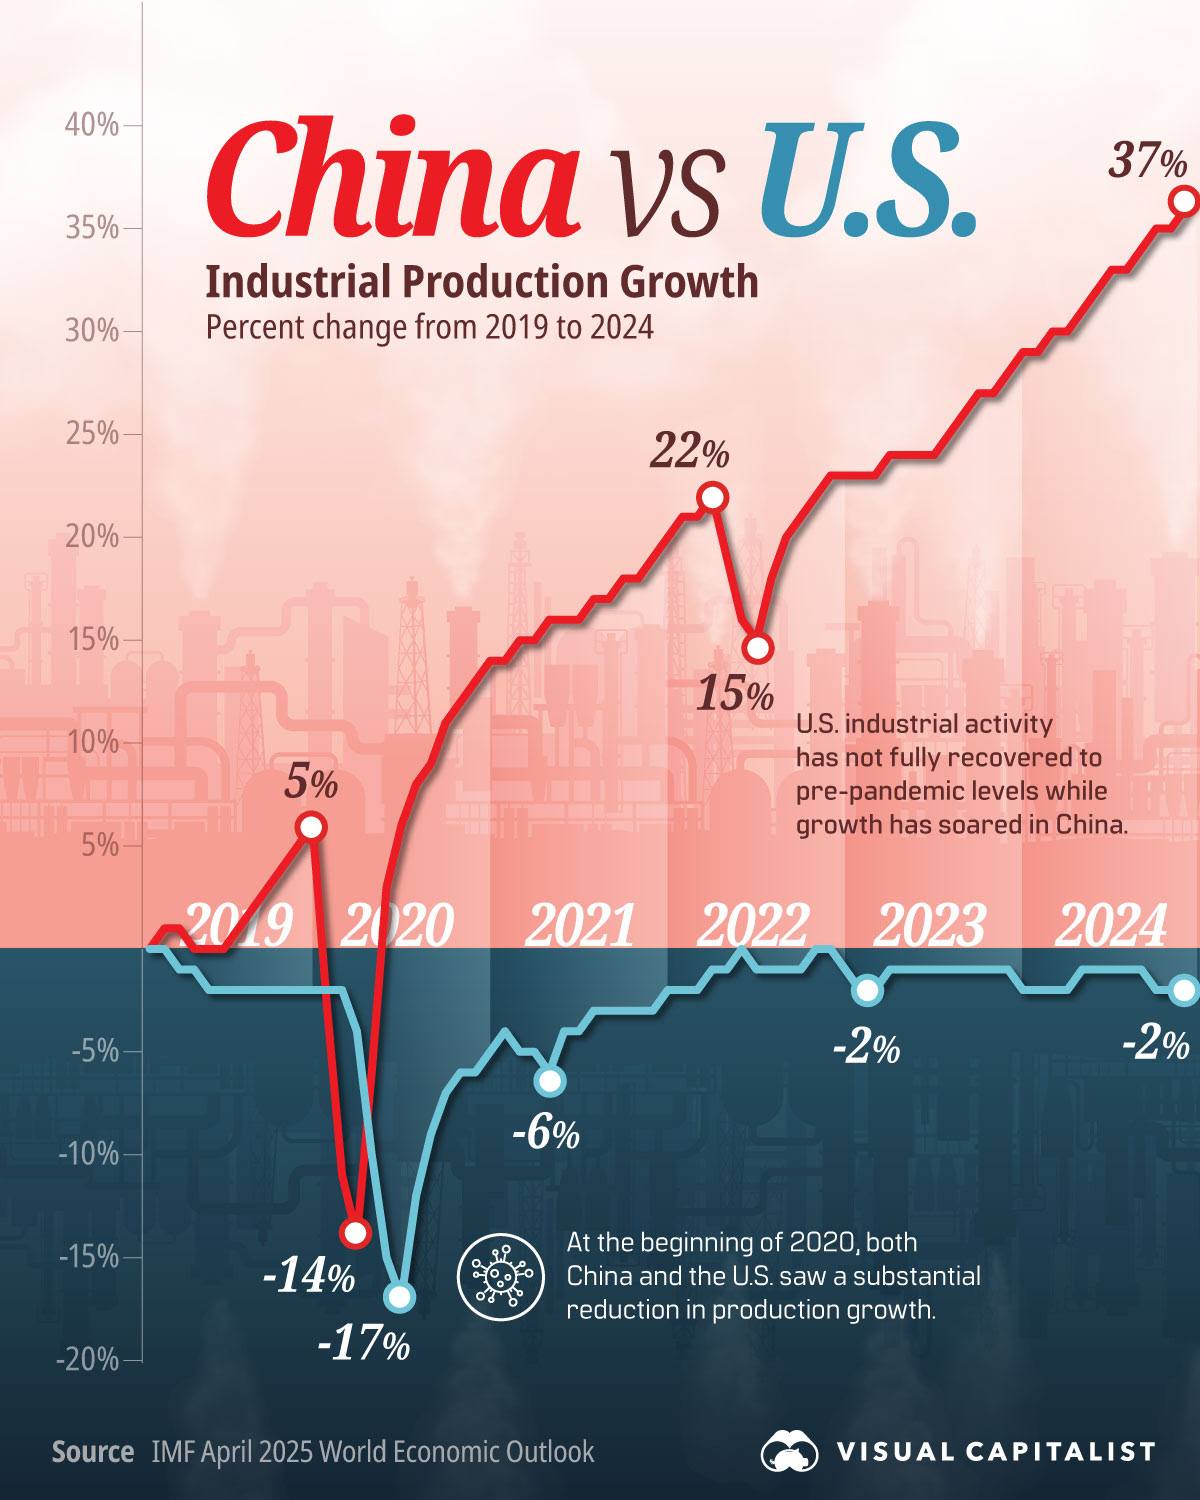
China's factories pulled ahead. Since 2019, Chinese industrial output is up 37%, fuelled by EVs, batteries and solar. US industrial production has barely returned to its pre-pandemic level. Chinese factories now produce more than 60% of the world's EVs and over three-quarters of global lithium-ion battery cells. The Inflation Reduction Act and the CHIPS Act are partly an attempt to bend this curve before the next decade locks it in. Source: Visual Capitalist.
How China Became the World's Trade Hub
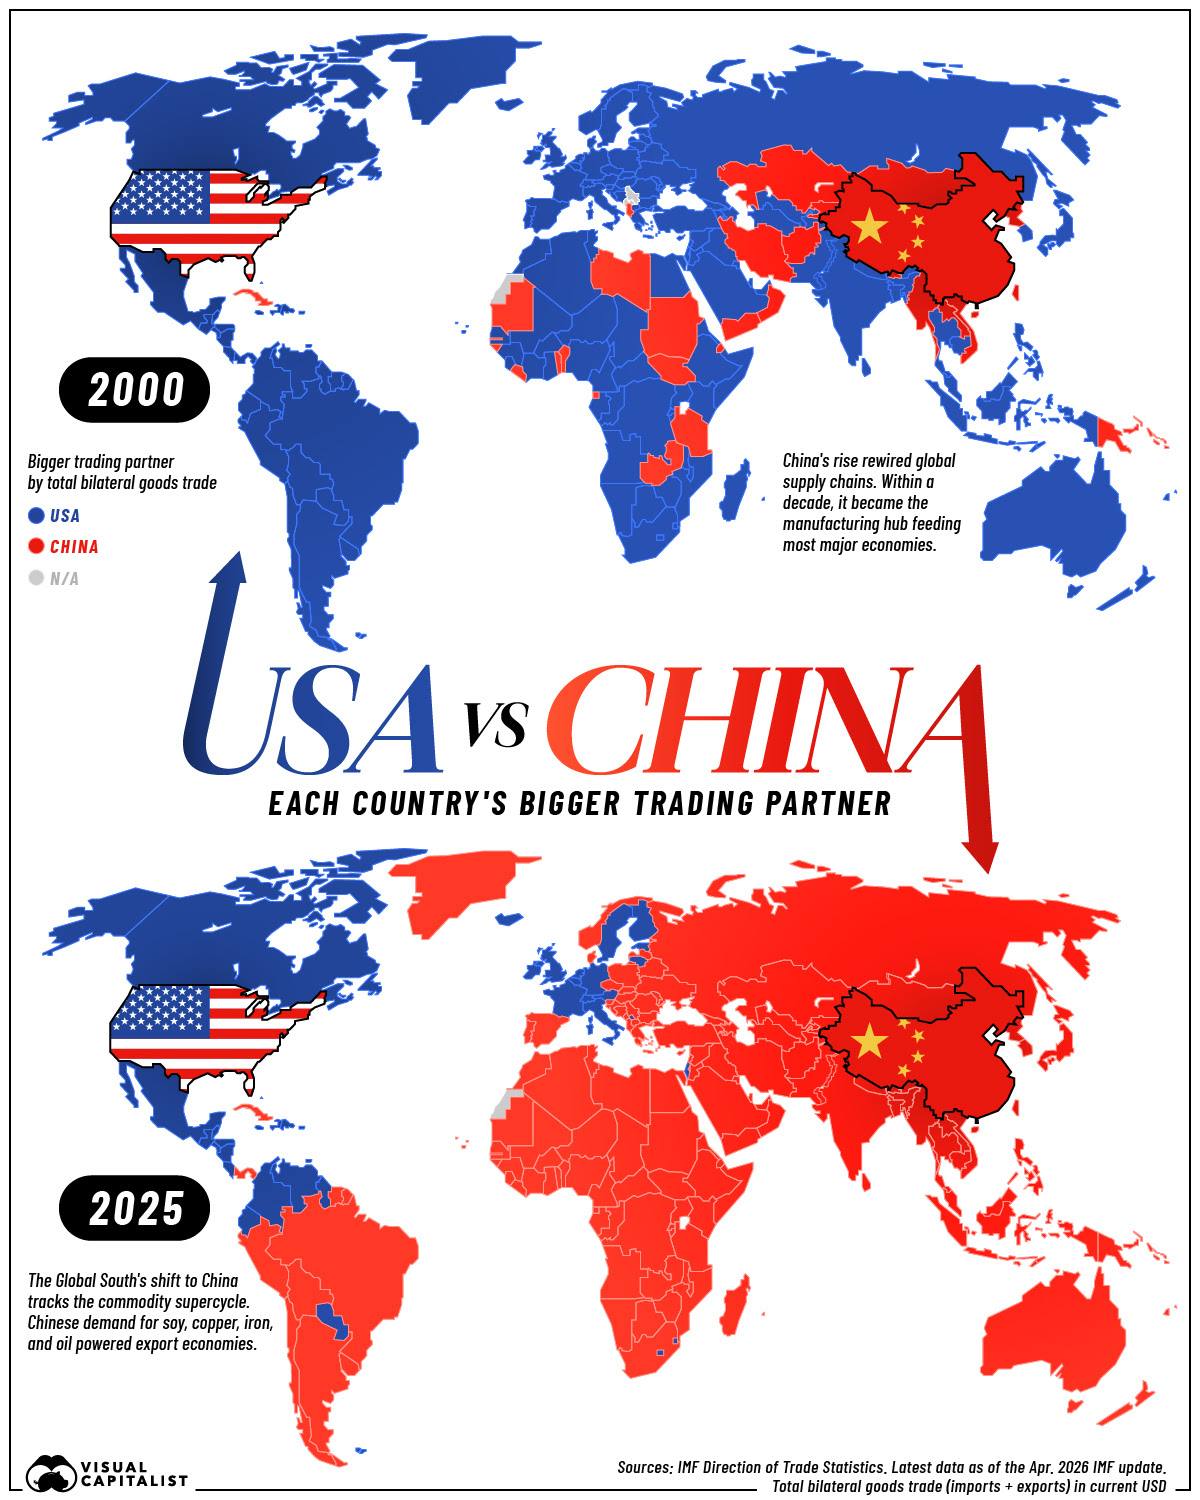
How China became the world's trade hub. In 2000, the US was the largest goods-trading partner for the majority of countries. By 2025, China had taken that role in most of them, including almost all of South America, Africa and the Asia-Pacific. The shift was driven by China's WTO accession in 2001 and the build-out of its export-led manufacturing base. This map is the single clearest illustration of what Washington is trying to claw back. Source: Visual Capitalist.
Inside China's 2025 Trade Network
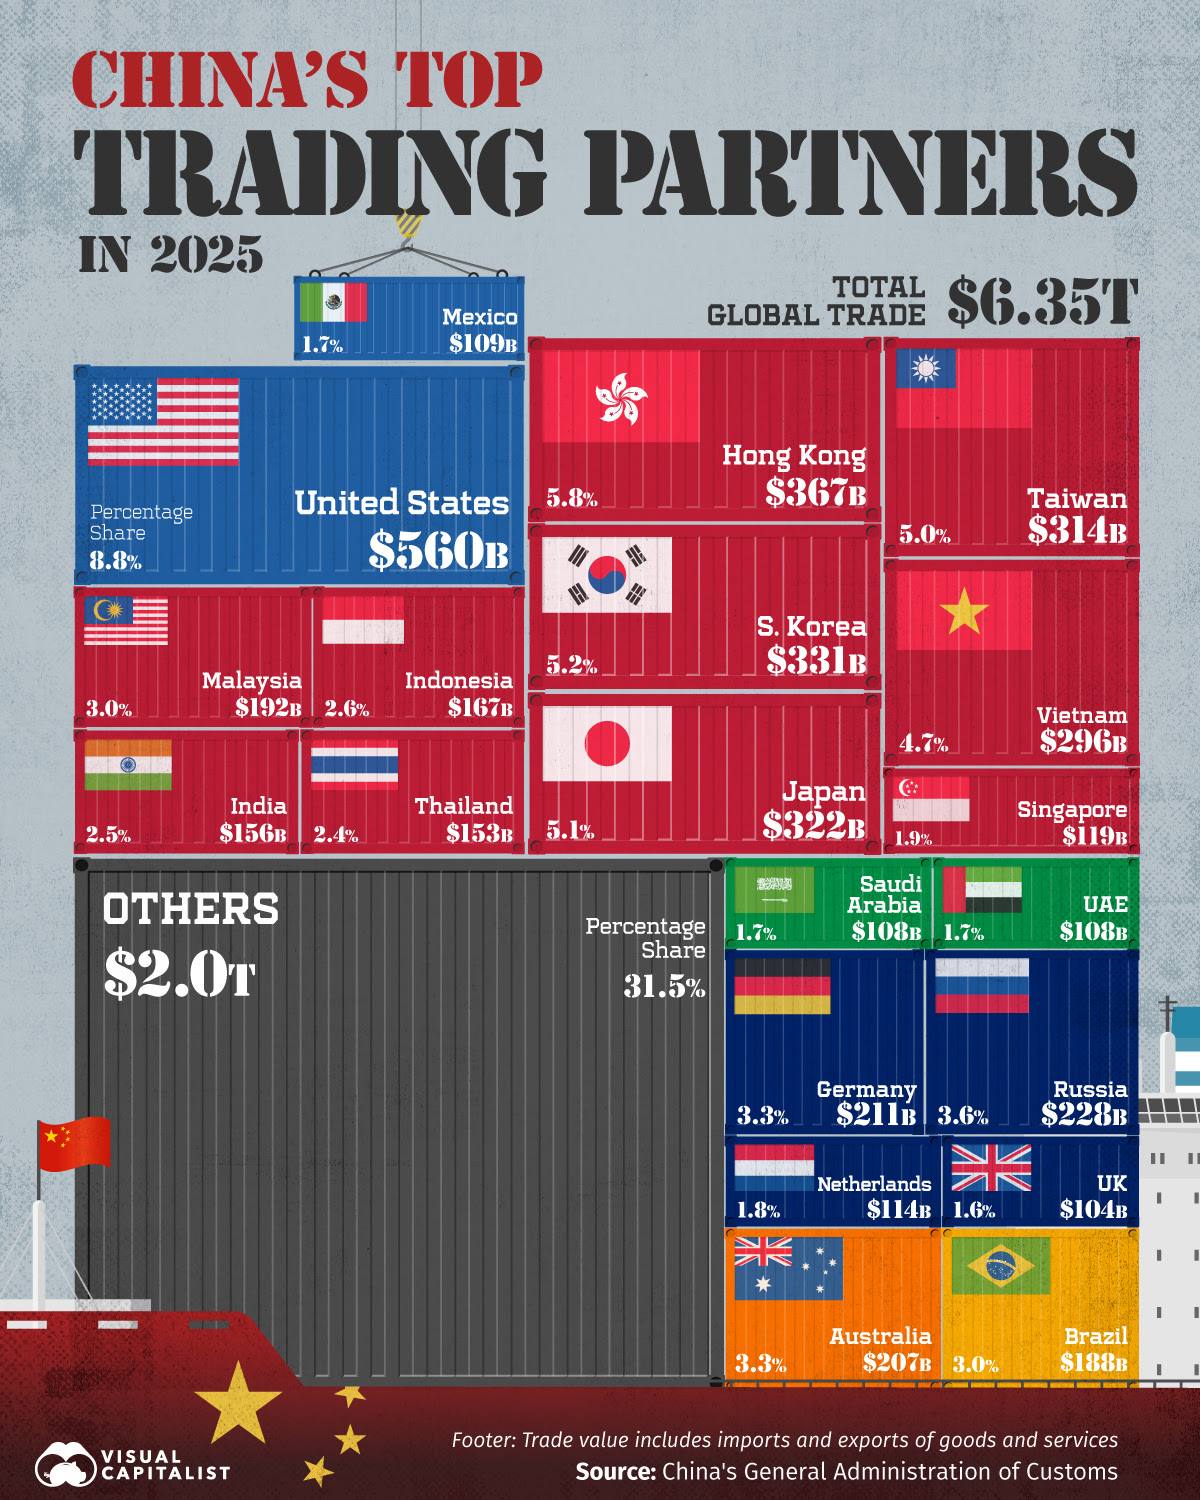
Inside China's 2025 trade network. Despite years of decoupling talk, the US was still China's single largest trading partner in 2025, at $560 billion in two-way goods trade, 8.8% of China's $6.35 trillion total. ASEAN as a bloc has surpassed the US, but no single country has. Hong Kong, South Korea, Japan, Taiwan and Vietnam round out the top six, reflecting the integrated electronics supply chain the US tariff regime has so far failed to unwind. Source: Visual Capitalist.
What the U.S. and China Sell Each Other
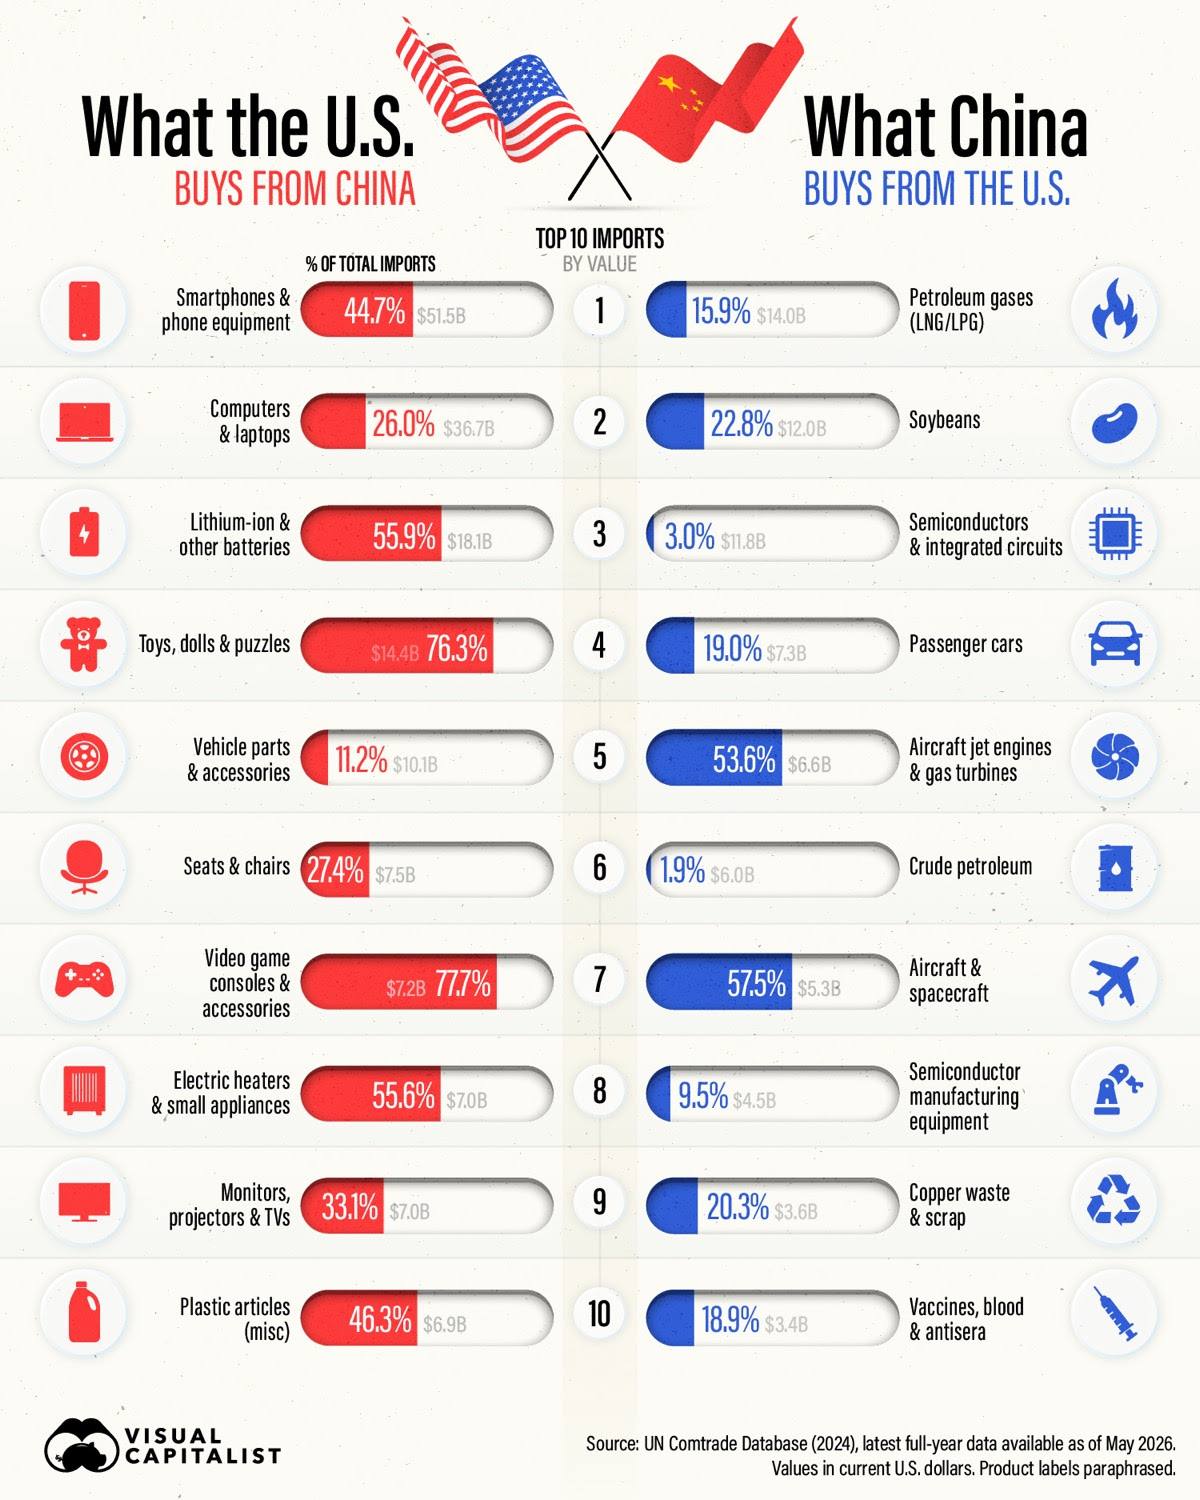
What the US and China sell each other. The bilateral mix reveals an old pattern, the US ships energy, raw materials and farm goods east, and buys finished electronics and consumer goods back. The concentration is the vulnerability. 44.7% of all American smartphone imports, 55.9% of lithium-ion batteries and 77.7% of video game consoles come from China. On the export side, soybeans remain the political flashpoint, the crown the US lost to Brazil in the 2018 trade war. Source: Visual Capitalist.
How Heavily Each Country Leans on Chinese Imports
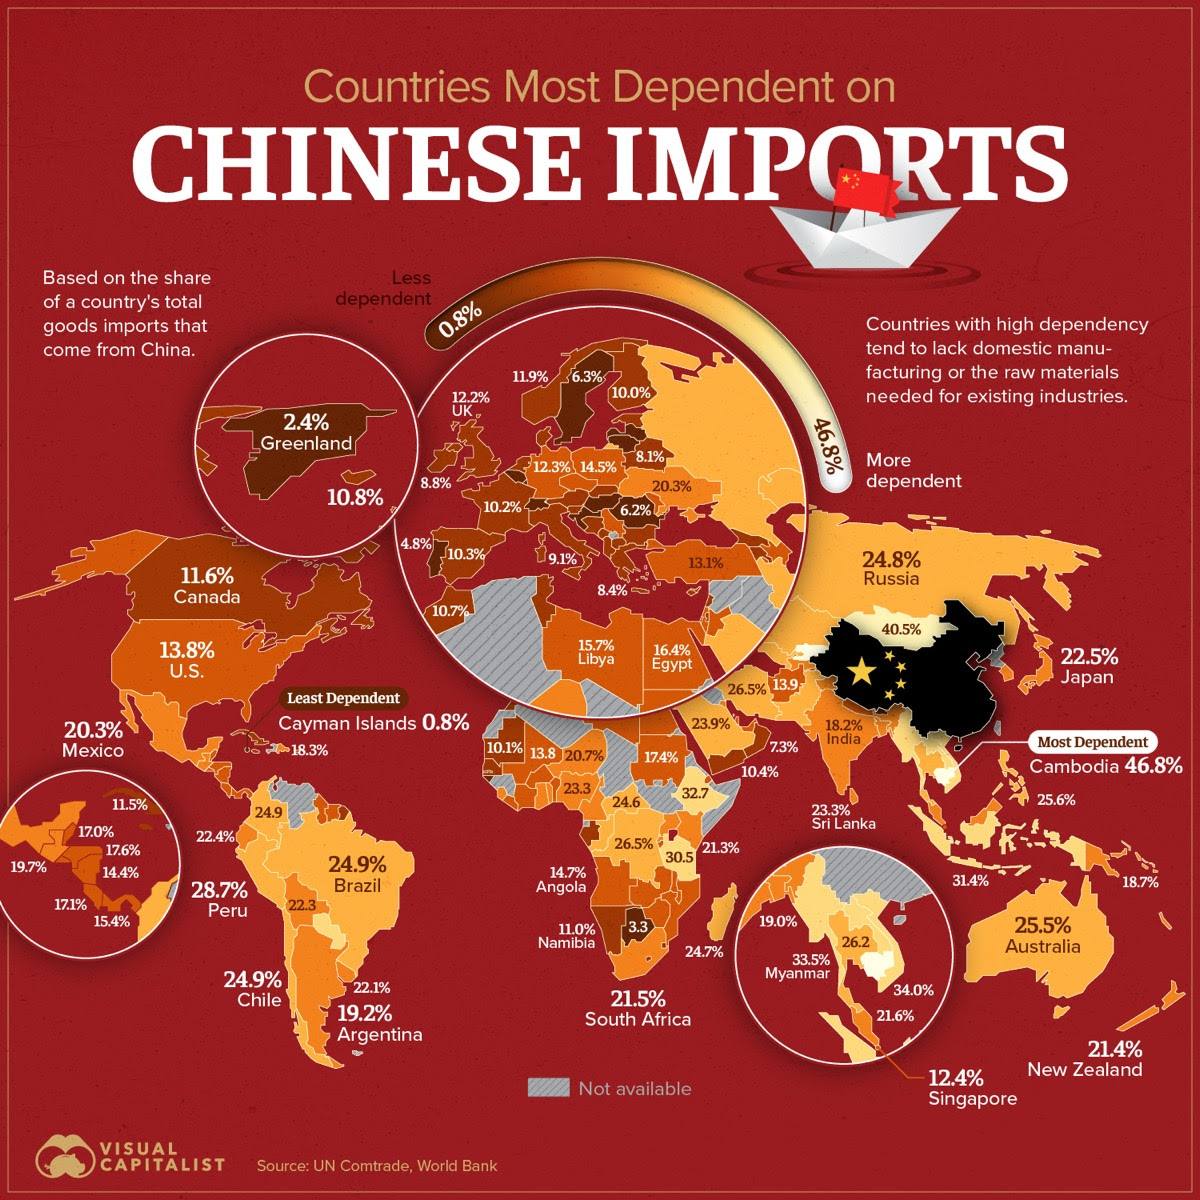
How heavily each country leans on Chinese imports. Cambodia tops the list at 46.8%. Russia, Australia, Peru, Brazil and Chile all source roughly a quarter of their imports from Beijing. Most developed economies cluster in the 10-15% range, the US at 13.8%. The headline shares understate the real exposure, even a tenth of total goods is heavily weighted toward chips, batteries and pharmaceutical precursors where a sudden cutoff would be very hard to replace. Source: Visual Capitalist.
Two Decades of Chinese Capital Going Global
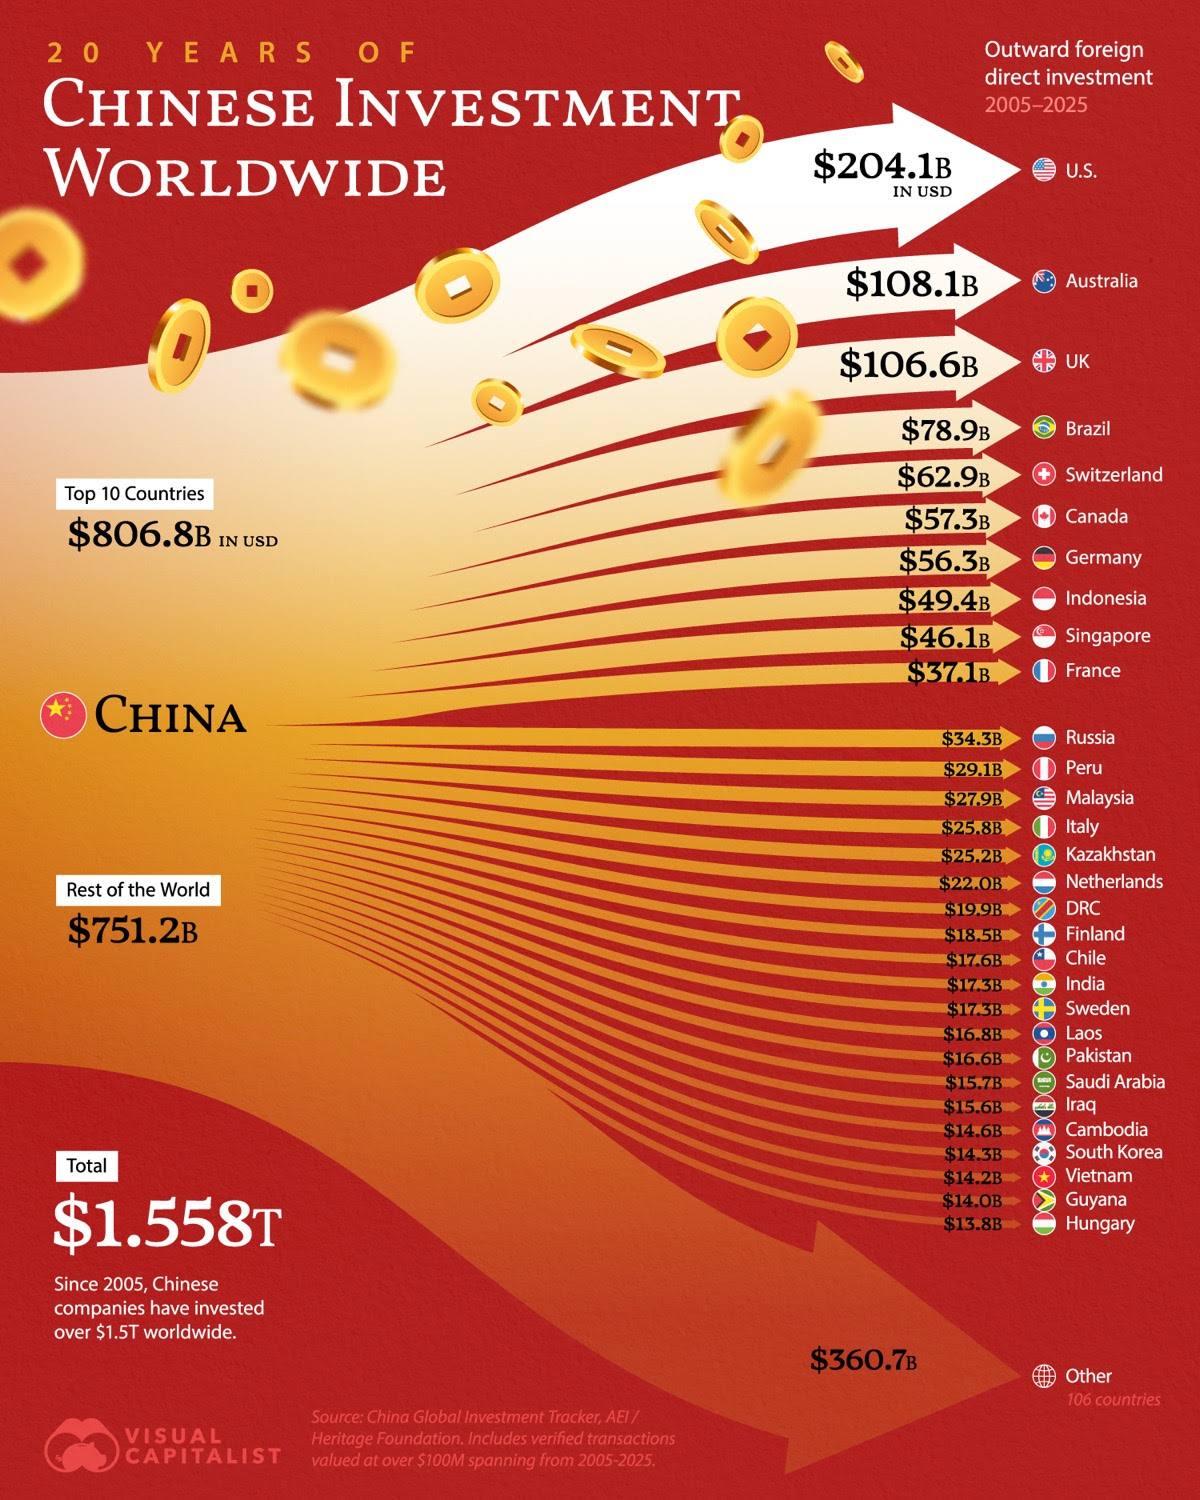
Two decades of Chinese capital going global. Since 2005, Chinese firms have invested $1.56 trillion abroad in deals over $100 million. The pattern surprises most readers, the US is the single largest destination at $204 billion, followed by Australia and the UK at roughly $107 billion each. This runs counter to the Belt and Road story, which is a separate, debt-based track. The capital has been flowing into the developed world, not just the developing one. Source: Visual Capitalist.
China's Lock on Critical Metals
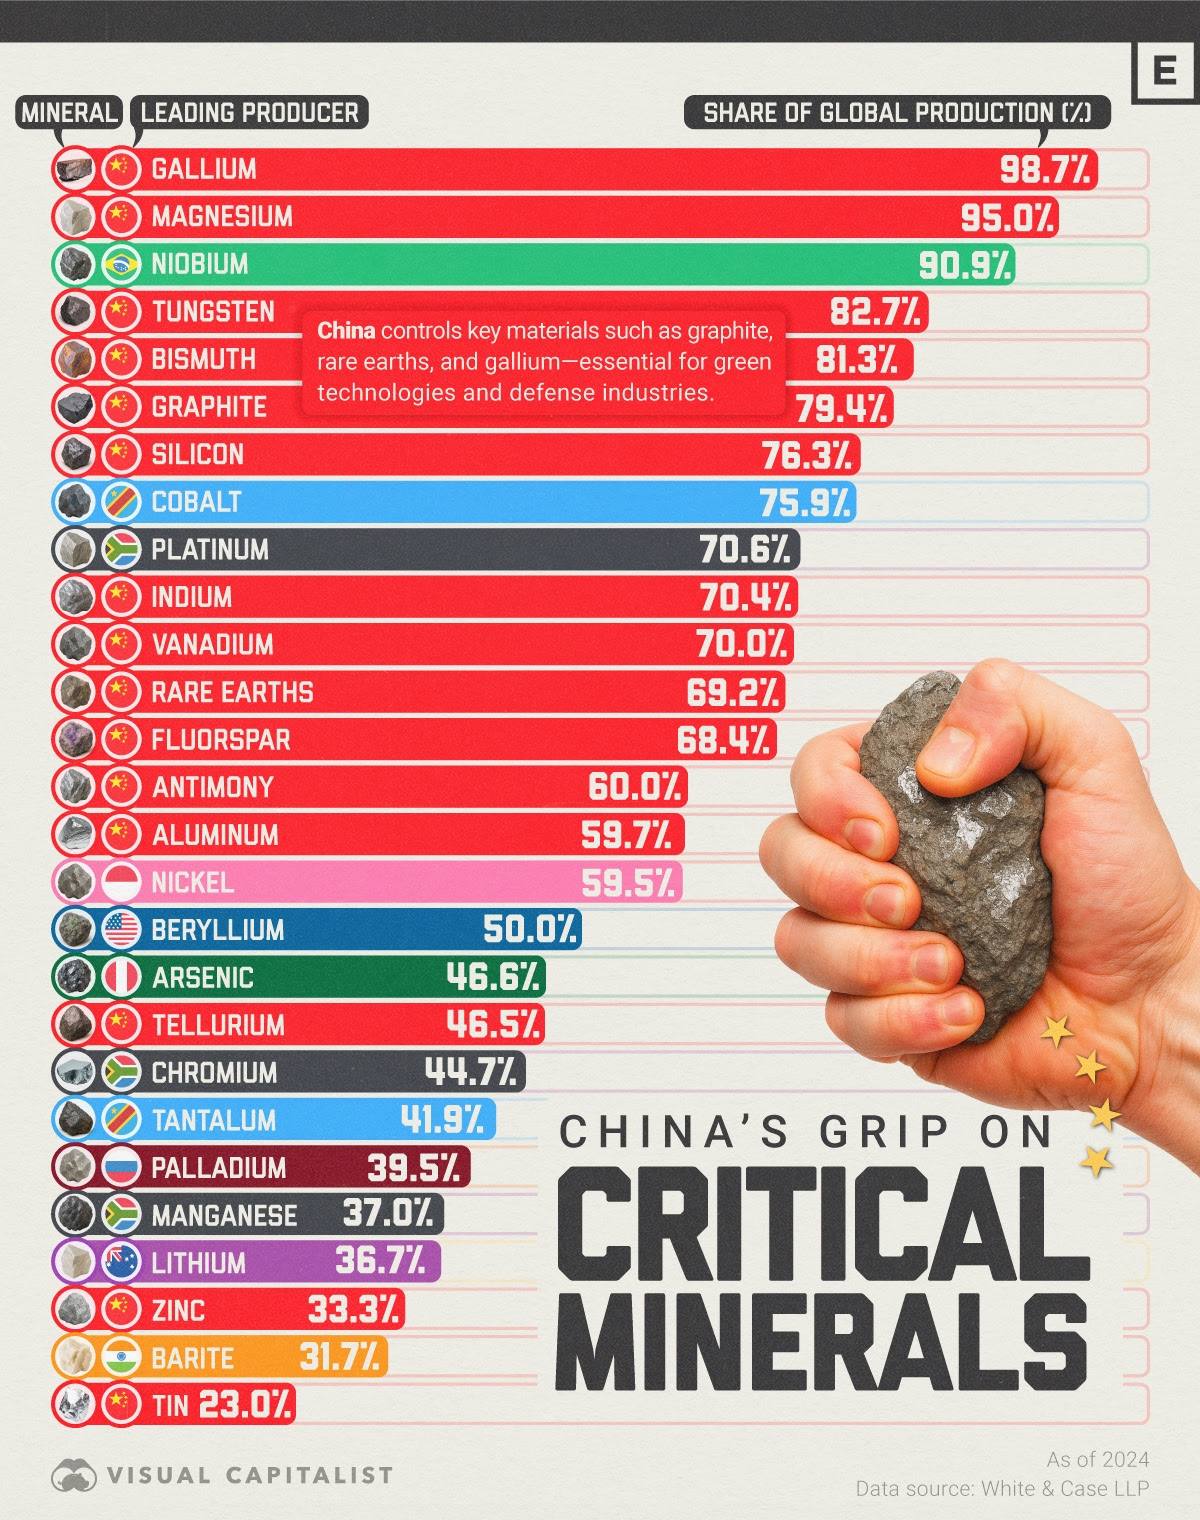
China's lock on critical metals. Across the 27 minerals charted, China is the leading producer for the majority. Its share exceeds 95% for gallium and magnesium, 90% for niobium, and roughly 80% for tungsten, bismuth and graphite. This is the file Beijing has been quietly reaching for since 2023, tightening export licenses on gallium, germanium, graphite and rare-earth magnet inputs. Each new restriction lands directly on US semiconductor, EV and defense supply chains. Source: Visual Capitalist.
China's Refining Dominance
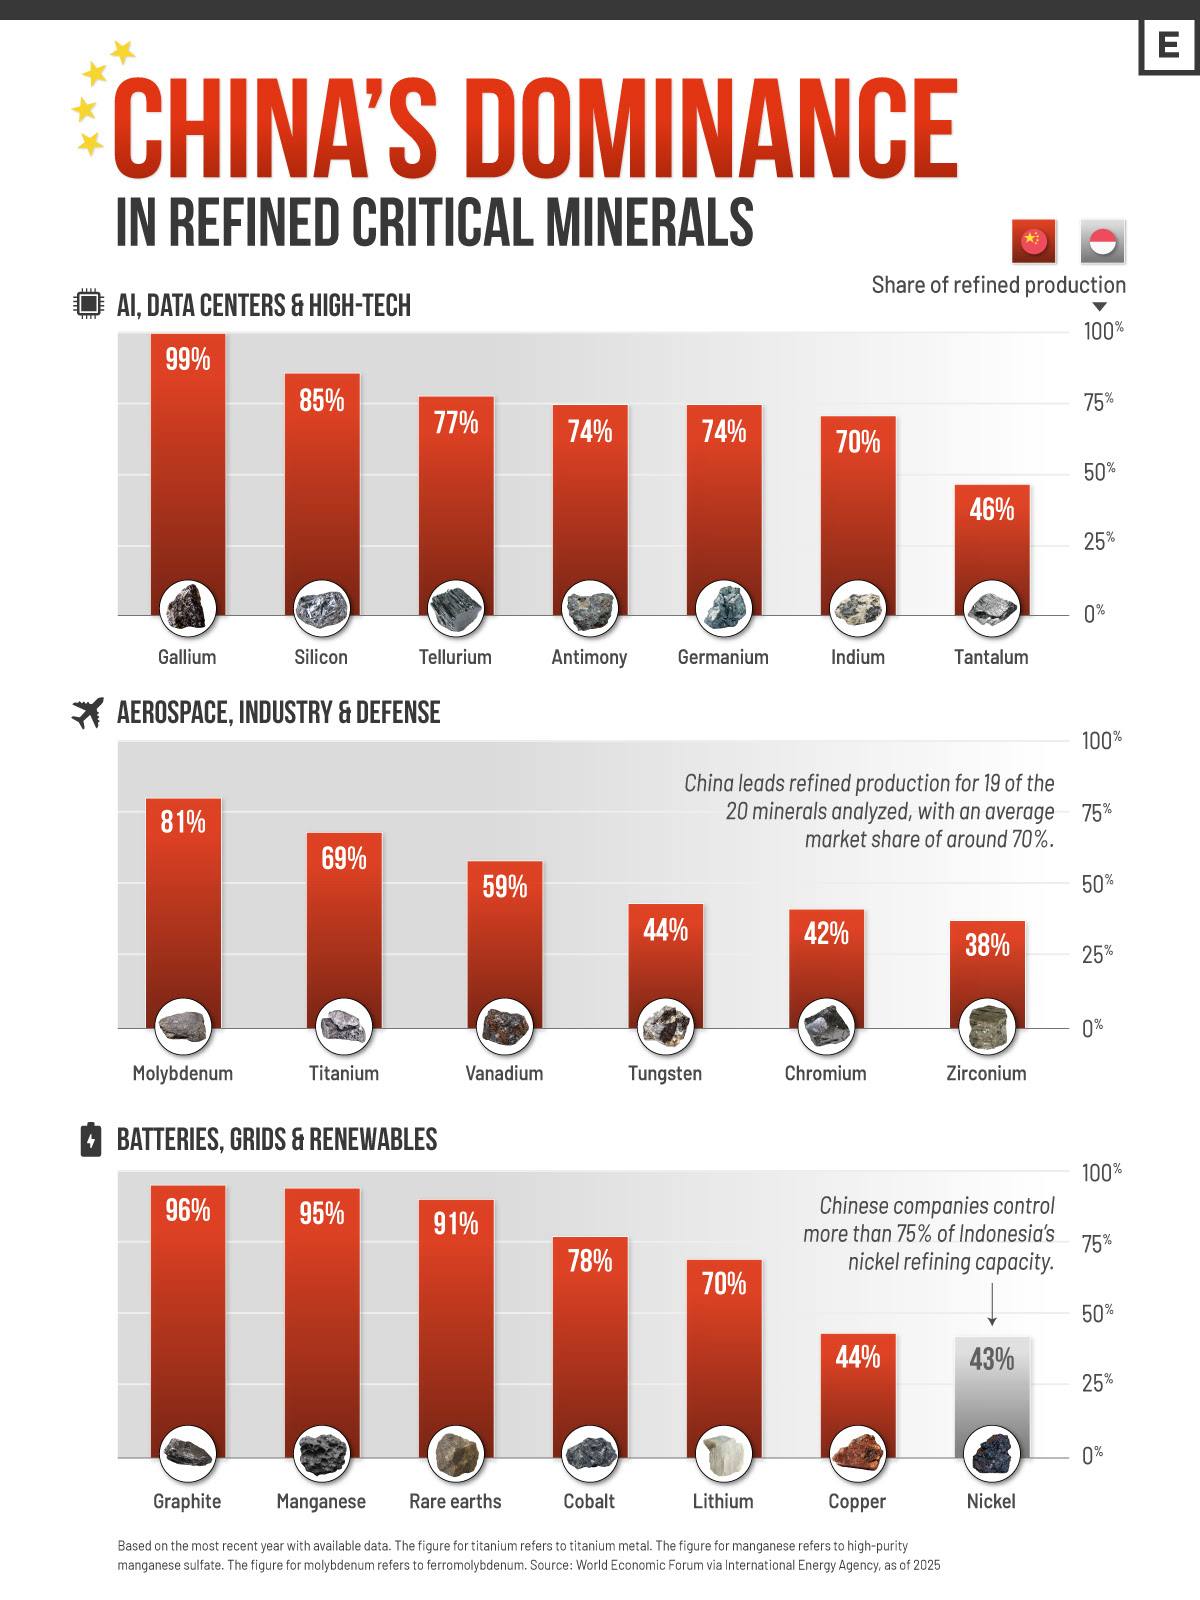
China's refining dominance, from AI chips to EV batteries. Refining is where China's lead is most decisive. Beijing leads refined output for 19 of the 20 minerals tracked, with an average market share around 70%. It is most extreme in the battery stack, 96% of graphite and 91% of rare earths, and high in AI hardware, 99% of gallium and 85% of silicon. Tariffs can be negotiated in a single meeting. Refining capacity cannot. Source: Visual Capitalist.
The Good Wrap
The close. China’s fishing fleet pushing within 150 miles of a US naval base in Japan, the quiet maritime face of a rivalry the summit could not resolve. The president’s own brokerage record, around 3,700 trades and a gift for buying high and selling low. The map of where the next billionaires will be made, tilting toward the Gulf and Asia. And, because every week here ends in a glass, Pinot Noir, the most demanding grape in wine, the same variety reading a dozen different soils. A fitting close for a week about divergence.
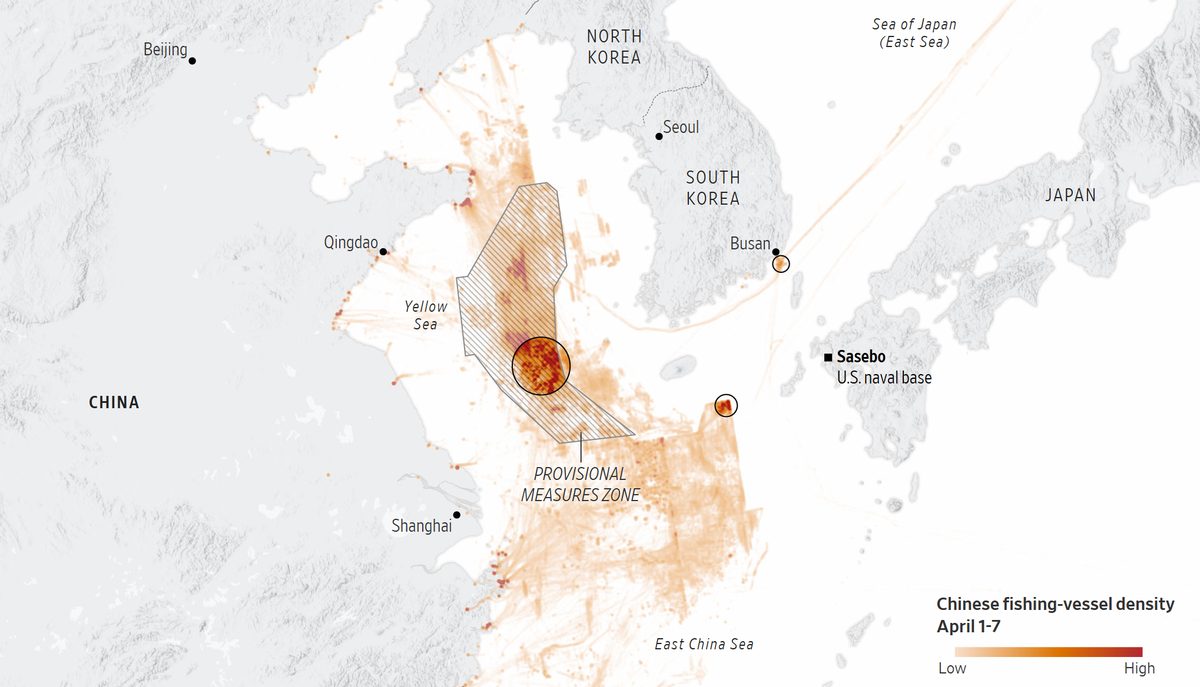
China is gaining power in contested waters. Chinese fishing vessels pushed within 150 miles of a US naval base in Japan last month, the latest advance in a decades-long campaign. Beijing officials often describe these fleets as normal fishing boats. The strategy poses a growing challenge for the US in the Pacific just as the administration stretches military resources across the Middle East, Latin America and the world. The maritime map is the quiet face of the rivalry the summit could not resolve. See the full WSJ interactive. Source: The Wall Street Journal.
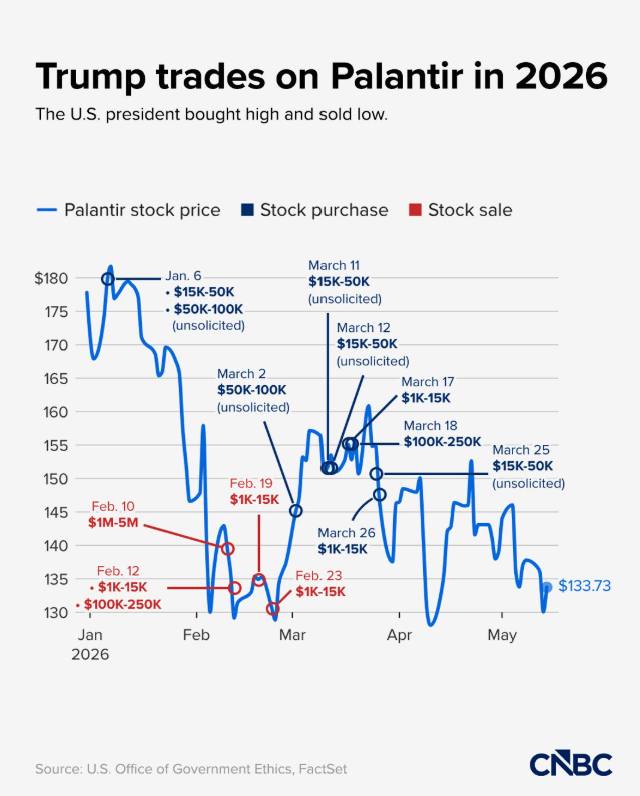
Trump trades on Palantir, and the timing tells a story. The disclosures show the president buying near the highs and selling into the February low, the worst possible sequence. It is the talk of the town because the same filings reveal roughly 3,700 individual trades across the year, an extraordinary cadence for a sitting president, several of them flagged unsolicited. The full trade log is public for anyone who wants to reference it. Source: CNBC.
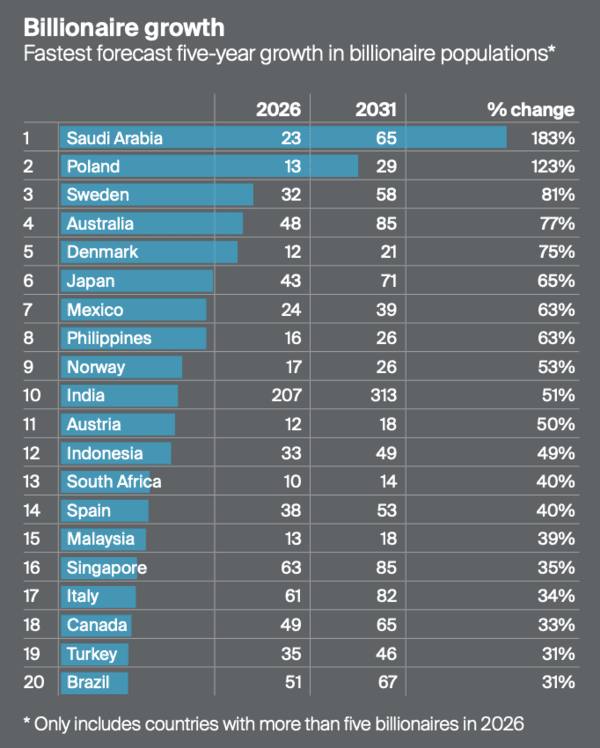
Where the world's new billionaires will be made. Over the next five years, at least 20 countries are forecast to see their billionaire populations expand by more than 30%. Saudi Arabia leads, its billionaire count projected to nearly triple, Poland second, more than doubling. Japan leads Asia at 65% growth, the Philippines close behind at 63%. India is projected to add more than 100 new billionaires by 2031. The map of new wealth is tilting toward the Gulf, Eastern Europe and Asia. Source: Knight Frank.
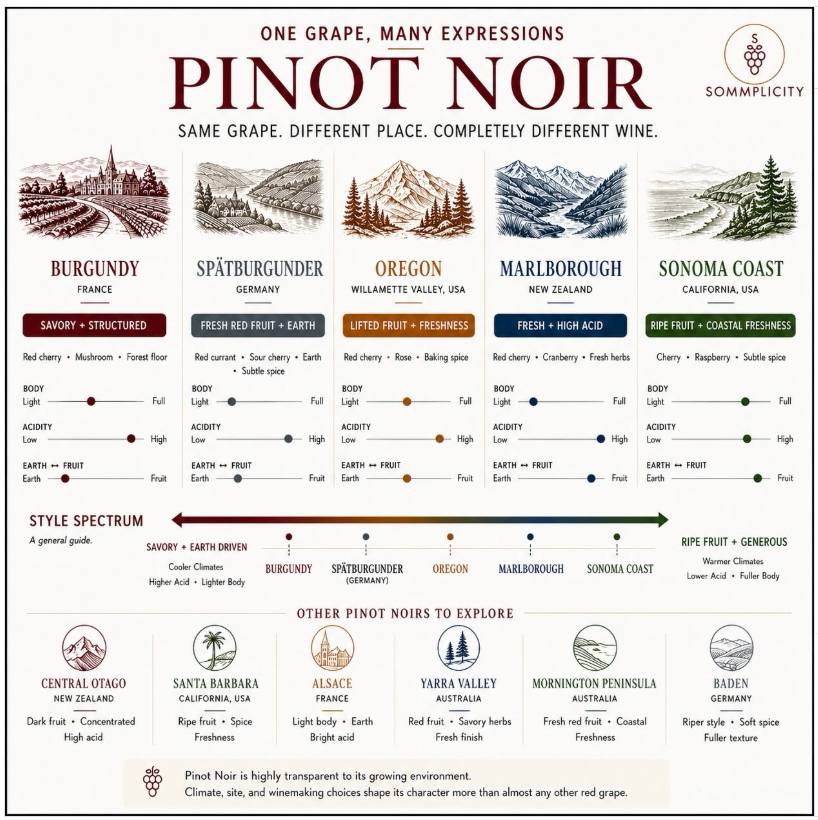
Pinot Noir, all over the world. The most demanding grape in wine, thin-skinned, site-obsessed, unforgiving of a warm year or a careless hand, and grown now from Burgundy to Central Otago, the Sonoma Coast to Mornington Peninsula, Baden to Patagonia. Each expression is the same variety reading a different soil and a different sky. A fitting close for a week about divergence, the same input, priced and expressed in a dozen ways depending entirely on the ground beneath it. What is your favourite expression? Source: Sommplicity.
Best,
Hoelon
WITPTW is a personal publication. Everything here is personal opinion and market commentary, written in a personal capacity. It is not investment advice and not a recommendation to buy or sell any security. It is not associated with, endorsed by, or representative of any employer, fund or company. Charts and images are reproduced from their original publishers, credited to their sources for commentary and discussion; all rights remain with the respective copyright holders.