Warsh's First
Personal views and market commentary. Not investment advice. Not associated with any employer or firm.
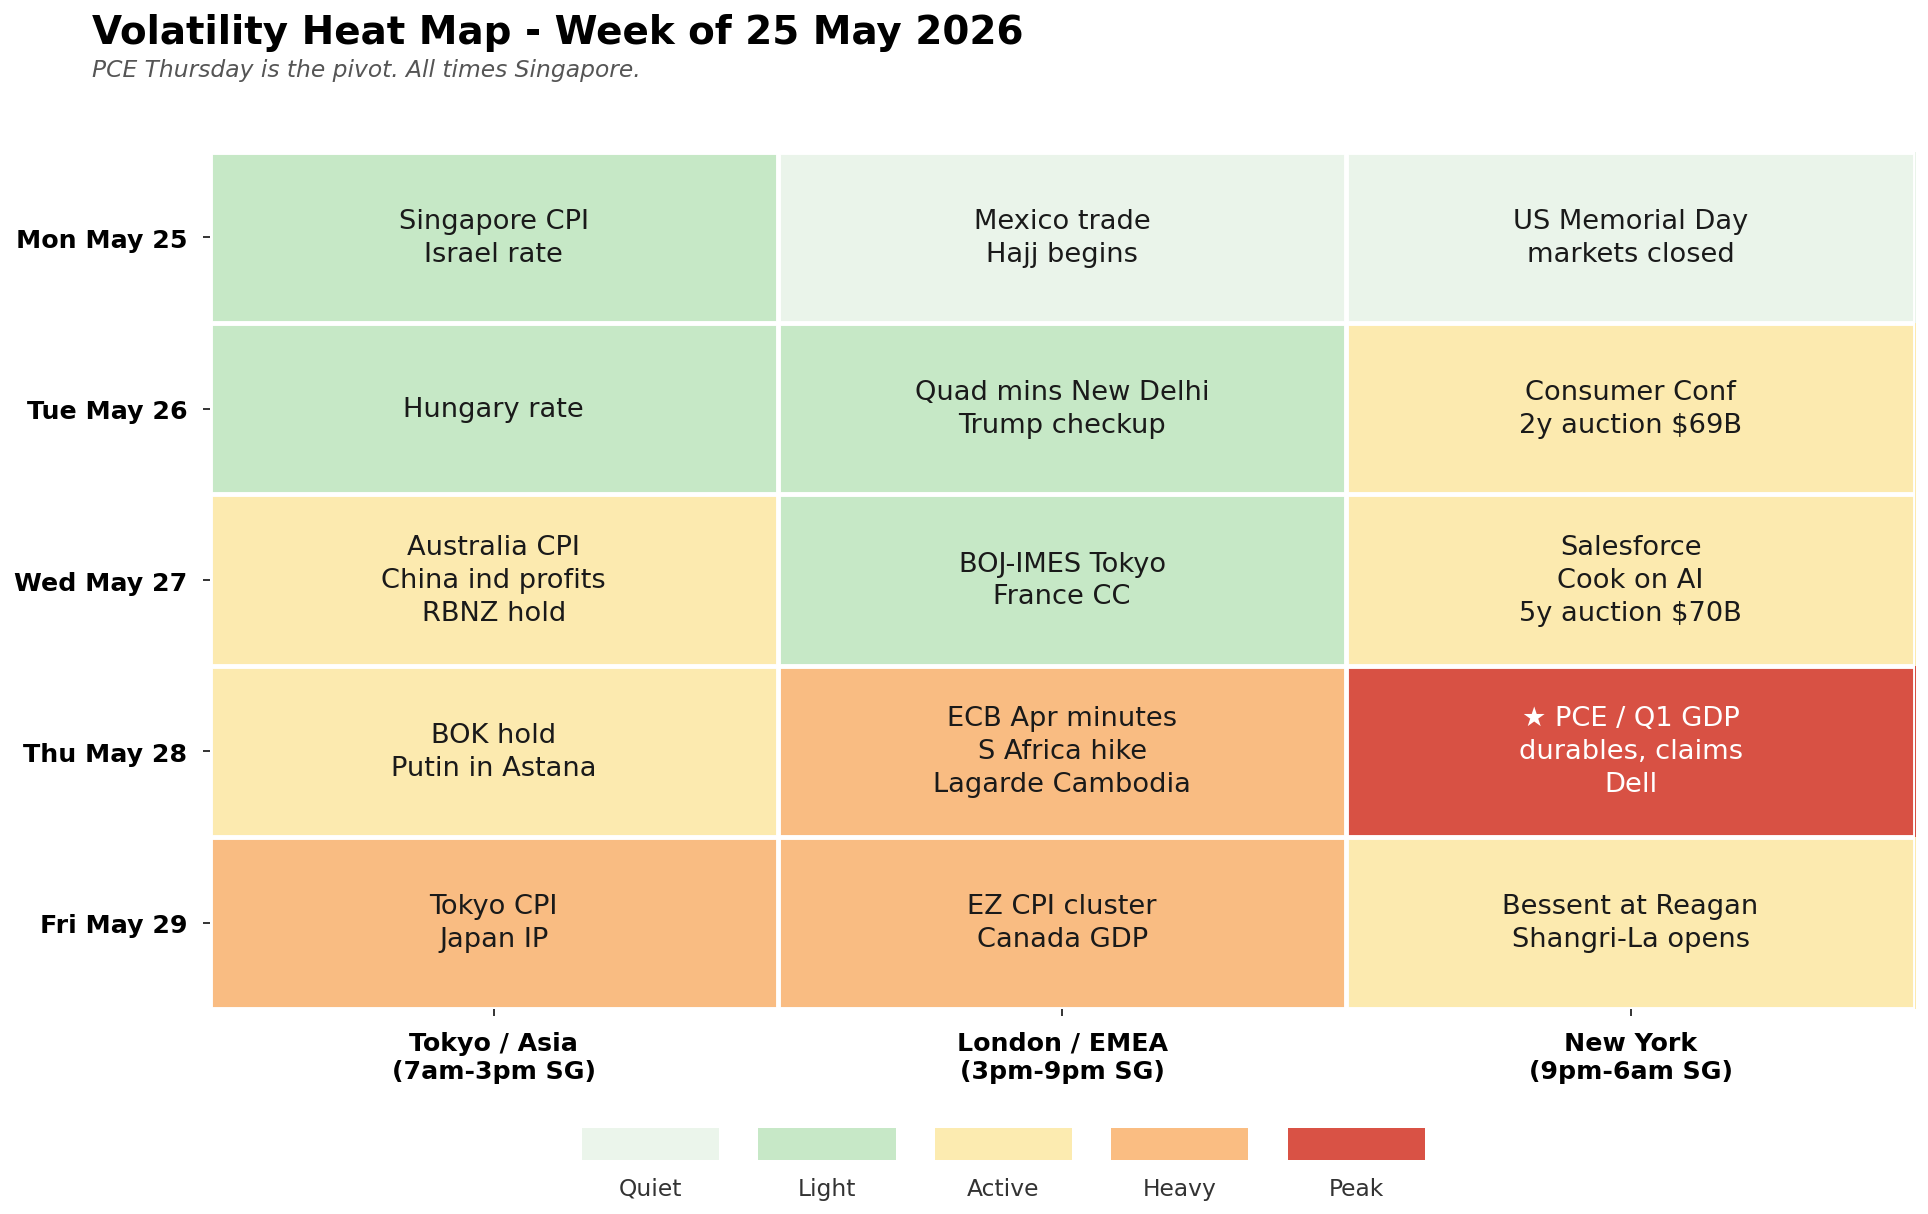
Volatility heat map for the week ahead, all times Singapore. The pivot is Thursday in the New York session, when April PCE, the Q1 GDP second estimate, durable goods, jobless claims and new home sales stack on the same morning. Thursday in Europe is heavy too with the ECB April minutes, the South African Reserve Bank's hike and Lagarde in Cambodia. Friday is the second-biggest day, the eurozone CPI cluster across the four largest economies plus Tokyo CPI and the Shangri-La Dialogue opening in Singapore. Wednesday cross-currents Australian CPI, the RBNZ, China industrial profits and Salesforce. Memorial Day Monday is by design quiet, US markets closed. Size into Thursday, hold powder for Friday's European inflation read.
"I’ve always wanted to write a book called What I Realize Now, which will go through the successive mistakes of beliefs that I’ve had my lifetime. ... Are we at a point of maximum pain? Is there so much fear right now, which is a great time to buy? Does it look like it’s going to go up forever? A great time to sell." — Paul Tudor Jones, on Invest Like the Best with Patrick O’Shaughnessy, “Lessons From 50 Years in Markets.” The interview I keep returning to this week is ultimately about evolution. The 2010 me does not run the book in 2026, and the 2026 me has to be a better, more complete PM. That means revisiting the successive mistakes of belief honestly. The harder lesson is about instinct. The first clean recognition, max pain, max fear, the catalytic moment, is where the alpha sits, before the crowd sees it. The mistake is letting that instinct get contaminated by ego, urgency or attachment to the P&L. The work is to keep the instinct clean and build the structure around it, planned sizing, predefined adds, clear invalidation, self-executing risk management. Most weeks are pairing and jabbing. The opening comes rarely. Stay liquid, stay intentional, and take the big shot when it appears.
"The Stone Age came to an end, not because we had a lack of stones, and the oil age will come to an end not because we have a lack of oil." — Sheikh Ahmed Zaki Yamani, Saudi Oil Minister. Three months into the Hormuz shock, the line lands differently. Every supply crisis accelerates the substitute that ends the era.
"The question is not whether artificial intelligence will shape the world. It will. The question is whether you will help shape artificial intelligence." — Eric Schmidt, on the University of Arizona’s 162nd commencement address, 15 May 2026, where the line drew boos from the graduating class. Three commencement speakers in three weeks have been booed for talking about AI. Schmidt at Arizona, Borchetta at Middle Tennessee ("Deal with it, like I said, it’s a tool"), Caulfield at Central Florida. One observer on X called them humiliation rituals, the question of who was being humiliated left open. The data underneath is sharper than the boos. Gen Z excitement about AI is down 14% in a year, outright anger up from 22% to 31%, and 44% of Zoomers across the US, UK and Europe say they have sabotaged their employer’s AI initiatives. The Americans most optimistic about AI are those earning over $200,000. Altman’s house took a Molotov cocktail in April; an Indianapolis councilman’s took 13 rounds and a "NO DATA CENTERS" note left under the doormat. Schmidt’s line is the warning and the trade. The AI capex bonanza meets a generation that does not consent to being shaped, and the political risk just moved from next decade to next year.
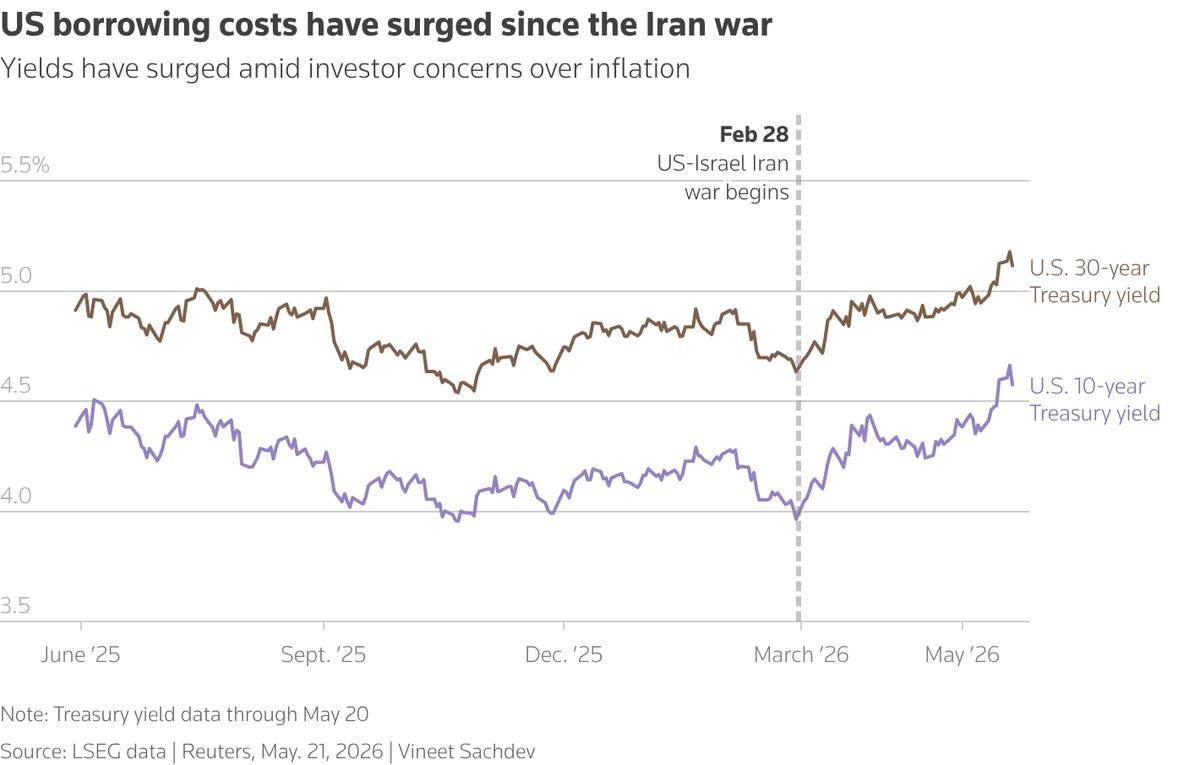
The systemically-key US Treasury market is in the breakout. The 10-year and 30-year yields have surged through resistance, the 30-year hitting its highest level since 2007 last week. The cracks from the war are deepening in the rate market that sets the global price of capital. Bond investors no longer believe central banks can look past the inflationary shock of a closed Hormuz, and the question they are pricing is no longer when the Fed cuts, but whether the next move is a hike. The chart is the framing for every paragraph below. Source: Reuters.
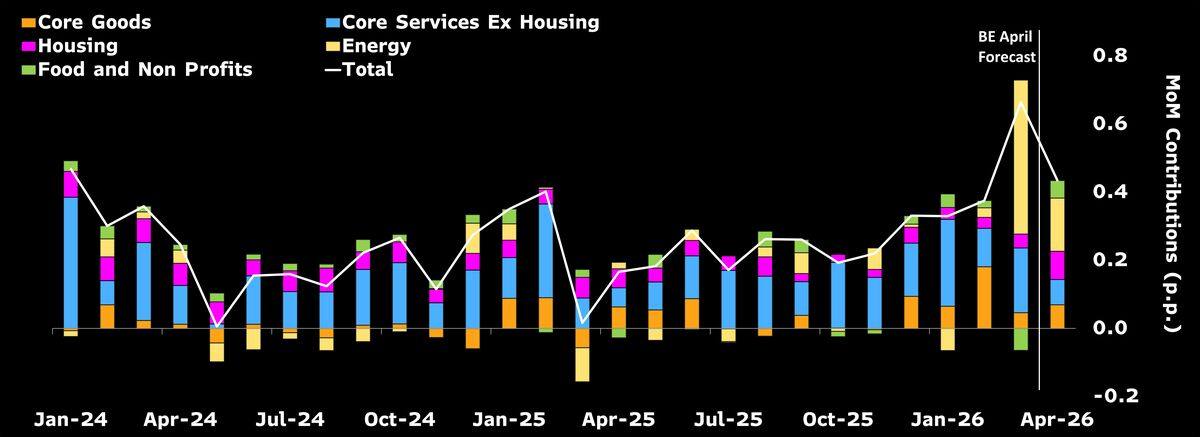
The US PCE on Thursday is the chilling reminder. Bloomberg Economics expects the headline price index to print 0.4% month-on-month, with core lifting year-on-year toward 3.3%. Energy and the housing rectification both add to the pressure, and a memory-chip shortage threads through the core. The path of the print is the call Warsh inherits at his first FOMC, where the easing bias the market has held for a year is in question. The split between Wall Street and Main Street is sharpest in this number. Source: Bloomberg Economics.
What is the plan this week?
At the time of writing, Trump is expected to announce a negotiated deal with Iran shortly. Markets will open with the optimism they have shown on every flicker of an off-ramp, the Strait of Hormuz the unspoken centre of the negotiation. The headline will trade like a reopening regardless of how much physical supply has actually been destroyed. The dollar should fade on the news into the Memorial Day long-weekend liquidity, long-end yields should ease for a session, equities should bid. None of that unwinds the inflation the war has already locked in.
The PCE on Thursday is the chilling reminder for Wall Street that Main Street has been living through for months. Consensus is 0.4% headline lifting core toward 3.3% year-on-year, the memory-chip shortage and a housing quirk both in the mix. Q2 nowcasts still point to stronger growth than the Q1 print. Last week’s tape was Nvidia parabolic, the Dow at intraday records, the S&P holding around 7,500, retail still spending into the tax-refund cushion. The question Warsh inherits, sworn in Friday, is no longer whether to cut sooner. It is whether his first move under the new chair is, improbably, up. Waller said Friday a hike is as likely as a cut and that he can no longer rule them out.
Bonds are lower across the G7. The US 30-year hit its highest level since 2007 last week, joining the multi-decade highs already set in UK gilts and Japanese 30-year JGBs. The breakout in long-end yields is no longer a country-by-country story. The same trade, out of duration at any price, has printed across four major bond markets. The eurozone CPI cluster Friday tells it another way: France lifting to 2.9%, Italy to 3.2%, Germany at 2.8% as fuel-tax cuts only partially pass through. The ECB April minutes Thursday will likely show the Council closer to a June hike than the market is positioned for, and EURUSD pinned below 1.15 on the dollar bid has the path back through 1.17 toward 1.20 if Iran lands and the ECB confirms. The other side of the same trade is Japan, where a steady Tokyo CPI Friday and a BOJ June hike pulled forward thin the yen carry.
Asia splits cleanly. China is running a quiet supply-chain prioritisation, sulfuric acid first, refined petroleum before that, and is the only major bond market not in the global selloff. Capacity utilisation rises inside China while the West absorbs the inflation. The rest of Asia is the price taker on the energy shock. The Quad foreign ministers meet in New Delhi Tuesday, Putin sits at the Eurasian Forum in Astana Thursday, and the Shangri-La Dialogue opens in Singapore Friday with Hegseth attending. Heading into the summer, liquidity thins and risk appetite shrinks. Sell in May never came; the calendar still says it should.
The plan this week. Patience on entry. The book is neutral on the dollar spot and starts buying three- to six-month USD upside, where the curve repricing pays without the headline chop. Pay US short end on any Iran-rally relief. Pay European rates as the ECB closes on a June hike, with a small long EUR sleeve added on the confirmation. Pay China short rates against the consensus that the easing continues. Long CNH on the supply-chain story that bids the currency quietly. Smaller sizing into June. Powder dry for PCE Thursday and Tokyo CPI Friday.
What did I learn last week?
Mon May 18: Yardeni called for a July hike to appease the bond vigilantes. G-7 finance ministers in Paris with global imbalances on the table. US reportedly proposed a temporary Iran oil sanctions waiver, then Axios said the White House rejected the latest peace draft as "not meaningful". China April activity printed on plan, industrial production +5.7%, retail +1.6%. NextEra and Dominion agreed to combine in an all-stock deal.
Tue May 19: Xi-Putin met in Beijing, framed as mutual development support. Canada April CPI 2.8% versus 3.1% expected, cooler. UAE Barakah nuclear plant hit by six drones launched from Iraq. EU-US trade deal reportedly reached at EPP level. US pending home sales +1.4% beat. Fed Paulson said a rate hike could be considered. Boeing confirmed 200-jet China deal with rare earths cooperation as part of the package.
Wed May 20: Nvidia $81.6B revenue, +85% year-on-year, $80B repurchase, demand "has gone parabolic". Treasury $16B 20-year auction tailed badly at 5.122% versus 4.664% prior. UK April CPI 2.8% versus 3.0%e, cooler. ECB June hike said to be "very likely" per press; Wunsch confirmed the bias. Anthropic expected profitable in June quarter, sales to reach $10.9B. ADI, INTU, AMD beat. Walmart cautious on the tax-refund cliff, Target beat and raised.
Thu May 21: Tokyo CPI 1.4% year-on-year, slowest since March 2022. Eurozone consumer confidence -19.0 beat. UK Manufacturing PMI 53.7 beat. US S&P Manufacturing PMI 55.3 strong, services elevated. Philly Fed -0.4 versus +17.8e, new orders collapsed. Jobless claims 209K. BofA card spending +4.8%. Iran-US negotiations reportedly to resume in Islamabad after Hajj (end May 30). LHA and Ryanair flagged stable fuel supplies through October.
Fri May 22: Kevin Warsh sworn in as Fed Chair Friday at 11am ET. Waller said a hike is as likely as a cut, can no longer rule them out. UMich final May 44.8 versus 48.2 expected, fresh record low. German IFO 84.9 beat. Putin reportedly aims to wrap up the Ukraine war by Dec 2026 on victory conditions. Russia rate held. Uber said to be considering takeover of Delivery Hero.
All week: S&P +0.9%, Dow +2.3% with intraday record, Nasdaq +0.5%, S&P holding around 7,500. Yields surged, US 30-year at a 2007 high, 10-year through 4.6%. DXY firmer, especially against the yen. Nvidia parabolic the marquee. Iran-US talks fluctuated on every flicker. Memorial Day weekend ahead.
What to look out for next week?
Mon May 25: US Memorial Day holiday, markets closed. UK, Hong Kong and South Korea also out. Singapore April CPI expected to rise to 2.9% from 1.8%. Israel rate decision, likely a 25-bp cut to 3.75%. Mexico trade. Thailand customs. The Hajj begins in Mecca. Anthropic’s Christopher Olah at the Vatican for Pope Leo XIV’s first encyclical on AI and human dignity.
Tue May 26: US Conference Board consumer confidence, expected at 92.0. Hungary rate hold at 6.25%. Sri Lanka expected +50bp hike to 8.25%. Dallas Fed survey. Trump medical and dental checkups at Walter Reed. Quad foreign ministers meet in New Delhi with Indo-Pacific security and the Middle East on the agenda. Texas Republican primary runoff. Treasury sells $69B of 2-year notes. Earnings: Xiaomi, ONGC, Fisher & Paykel Healthcare.
Wed May 27: Australia April CPI expected at 4.0% from 4.6% on fuel-tax rebates. China April industrial profits expected at 16.4% YTD year-on-year. RBNZ rate decision, expected hold at 2.25% with revised inflation projections. Salesforce earnings. Fed Cook on AI at Stanford. BOJ-IMES Conference begins in Tokyo, Ueda and Kashkari on the panels. France consumer confidence. Treasury sells $70B of 5-year notes. Brazil mid-month CPI. Banxico inflation report.
Thu May 28: The PCE day. US April PCE expected 0.4% headline, 0.3% core, year-on-year core toward 3.3%. Q1 GDP second estimate 2.1%. April durable goods +3.0%. Jobless claims, new home sales. BOK rate decision, hold at 2.50% with hawkish guidance. South Africa Reserve Bank hikes 25bp to 7.00%. ECB April monetary policy account. Norway GDP. Putin at the Eurasian Forum in Astana through May 29. Reykjavik Economic Conference with Williams, Bailey, Schlegel. ECB Lagarde at the Francophone Central Bank Governors meeting in Cambodia. Dell earnings. NZ 2026 budget. Humanoids Summit Tokyo. Treasury sells $44B of 7-year notes.
Fri May 29: Tokyo May CPI expected at 1.5% steady, the read on whether the BOJ June hike pulls forward. Japan industrial production expected -1.4%. Eurozone CPI cluster — France 2.9%, Spain 3.5%, Italy 3.2%, Germany 2.8%. Canada Q1 GDP expected +1.3% annualised after Q4’s -0.6%. Bessent at the Reagan National Economic Forum in California. The IISS Shangri-La Dialogue opens in Singapore, Hegseth attending, through May 31. Sovereign rating reviews for France, Hungary and South Africa. Tokyo unemployment, retail sales. Costco earnings.
All week: PCE Thursday versus Tokyo CPI Friday bookend the data. Salesforce, Dell and Costco the late-season earnings markers. The Eurasian Forum, the Quad and Shangri-La are the geopolitical scaffold. Memorial Day Monday opens the seasonally lighter trading regime.
Beyond next week
May 30+: End of Hajj. Iran-US negotiations expected to resume in Islamabad, draft text reportedly already being prepared.
Early June: NATO foreign and defence ministers meet in Brussels.
June 11: ECB rate decision, the June hike vote alive.
June 16-17: Warsh’s first FOMC with the SEP re-thought. The call on whether the first move under the new chair is, improbably, up.
June 17-18: BOJ decision, swaps still around 75% for a 25-bp hike to 1.0%.
Late June: SpaceX expected to trade on Nasdaq; OpenAI confidential IPO filing reportedly imminent for September pricing.
Regimes
US growth signal stays clean, Warsh’s first move improbably up. Hot CPI, hot PPI, retail still spending into the tax-refund cushion, Yardeni called the vigilantes, Waller said a hike is as likely as a cut. The book is neutral on the dollar spot and starts buying 3-6 month USD upside, paid US short end. held, week 2
Synchronized G7 long-end stress, US the latest to confirm. US 30-year at a 2007 high last week, UK and Japan already at multi-decade highs. The same trade across four political systems. Yen carry vulnerable as BOJ June pulls forward. Short yen cross. evolved, week 3
China running a quiet supply-chain prioritisation. Sulfuric acid first, refined petroleum before that, the only major bond market not in the global selloff. Capacity utilisation rises inside China while the West absorbs the inflation. Pay China short rates, long CNH. new, week 1
The equity-flow story turns, European capital starts coming home. Mag 7 FCF negative versus earnings, S&P earnings-yield gap at its lowest since 2002, eurozone Q1 the strongest earnings print in three years. Pay European rates, small long EUR sleeve added on ECB confirmation. new, week 1
The credit market is quietly hedging the Mag-7 capex story. CDS trading volume on Google, Meta, Microsoft, Amazon and Oracle has surged from roughly $500M in Q1 2025 to nearly $6B in Q1 2026, with net notional outstanding through $13B by Q2 2026. Wall Street hedging desks are the biggest buyers. The credit professionals are no longer treating Big Tech as a homogeneous AAA-adjacent block. No position, the canary. evolved, week 5
Shifts (if → then)
Hot PCE Thursday → curve prices more hikes, dollar extends, the 3-6m USD upside structures pay quickly. new
Iran deal headline lands hard → temporary USD and long-end relief; use the dip to add to the 3-6m USD upside. new
Tokyo CPI hot Friday → BOJ June hike pulled forward, yen carry unwind accelerates, short yen cross pays. new
Eurozone CPI cluster hot Friday plus dovish ECB minutes → bunds sell off, paying European rates confirms, long EUR sleeve added. new
Boeing 200-jet China deal cracks → Trump-Xi reset stalls, CNH and paying CGB rates both reprice. new
MOVE keeps rising while FX vol stays pinned at the lows → the gap closes the wrong way, FX vol catches up, the VAR shock arrives. carried
USDJPY breaks 155 sustainably → air pocket below to 152, accelerated yen rally, BOJ June hike pulled forward. carried
Tails
VAR shock in an unprepared market → positioning wrong-footed, the curve shifts violently, forced deleveraging cascades. week 2
1970s replay, yields rise into a recession because the Fed cannot cut → the inflation print blocks the rate cut, growth softens, the curve steepens in the belly. week 2
Trump and Bessent fight the curve, Warsh holds or bends → markets reprice institutional risk premium, gold rallies, dollar weakens structurally. week 5, evolved
Yen carry unwind contagion → Japanese capital stays home, the bid that funded G7 deficits for two decades disappears. week 2
Hormuz deal walks back, physical supply destruction persists → oil $130, the masked deficit stops being masked. week 7
Trump-Xi-Putin loose synchronisation → wars and rivalries managed toward holding patterns, not resolutions; geopolitical risk map redraws. week 3
AI capex air pocket → the spending is vast, fast and circular, the credit market already buying Mag-7 CDS at multi-year volume highs, and a Nvidia stumble cracks the whole stack. week 2
Manic Monday
Memorial Day Monday in the US, markets closed. The Asia open carries the rare relevant data print of Singapore CPI before drift sets in. Israel’s central bank likely cuts to 3.75% as the shekel’s 20% surge gives them room. The Iran headline expected from Trump is the main read of the day, and the maps below trace what physical supply has actually been moved and what has not.
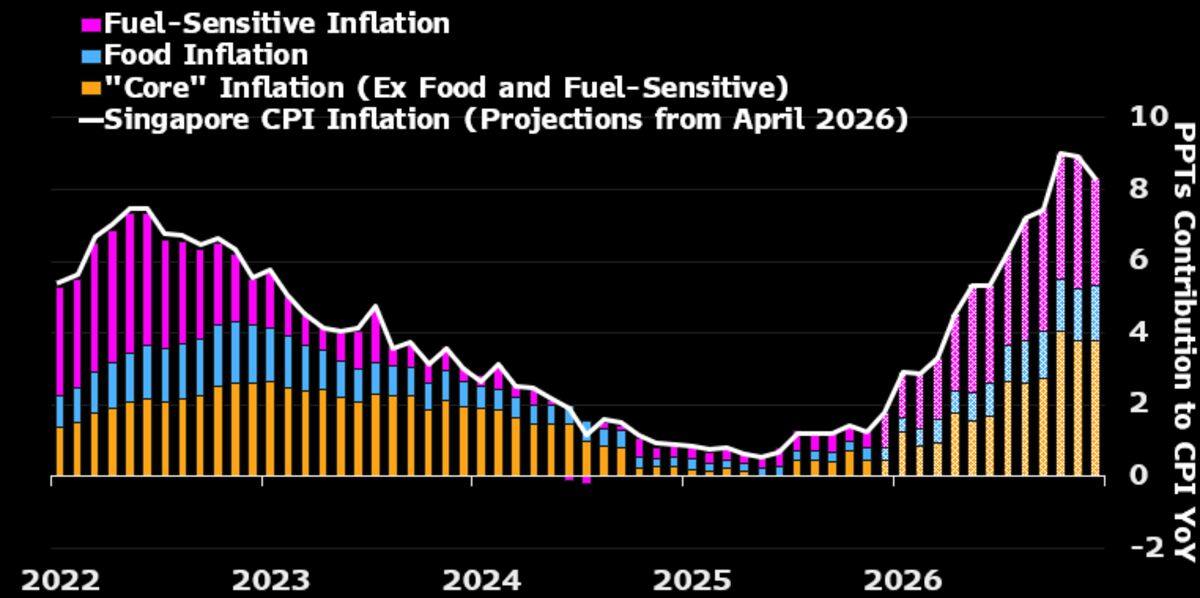
Singapore April CPI likely rose to 2.9% year-on-year from 1.8% in March, the city-state's import basket caught in the war's energy pass-through. The Singapore dollar's strength is the cushion, the MAS appreciation bias absorbing part of the imported pressure. Electricity tariffs are based on the preceding quarter's average fuel cost, so April through June only partially reflects the Hormuz shock. The full transmission lands in the second half. The print is Asia's first read of the week. Source: Bloomberg.
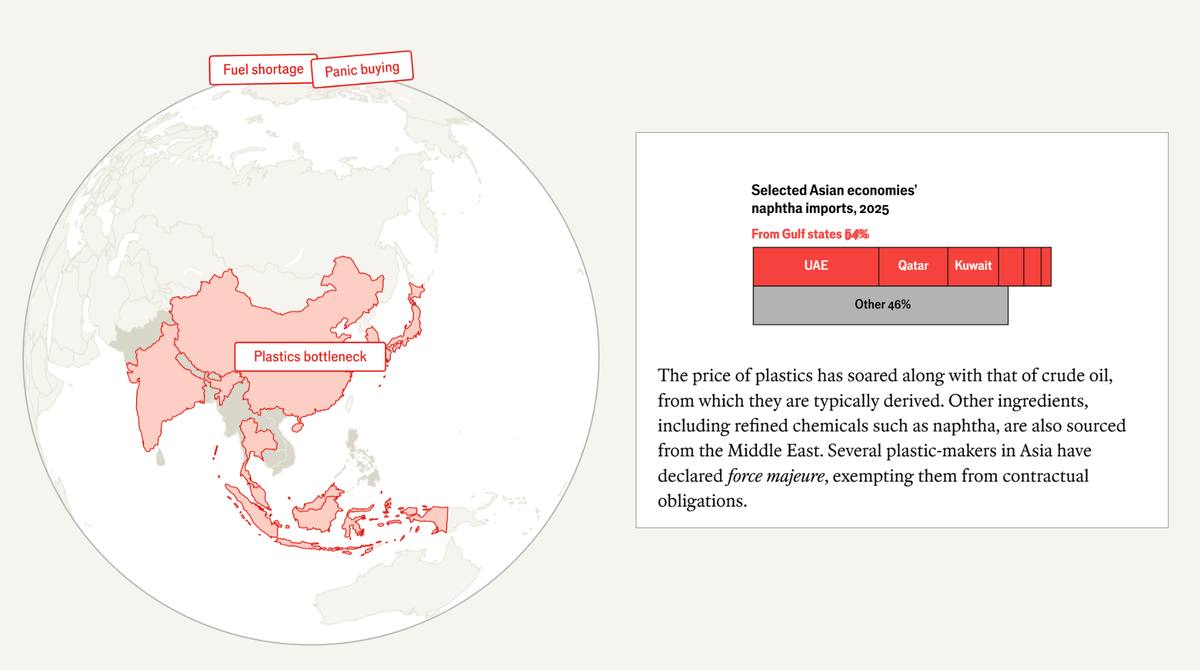
Asia's plastics bottleneck. Selected Asian economies source 54% of their naphtha imports from the Gulf — the UAE, Qatar and Kuwait carrying most of that share. With the Hormuz disruption choking flows, the price of plastics has soared along with crude, and several plastics makers in Asia have declared force majeure, exempting them from contractual obligations. The petrochemical channel is the cleanest example of how a Gulf oil shock becomes an Asian manufacturing shock through chemistry rather than headlines. Read the full Economist interactive. Source: The Economist.
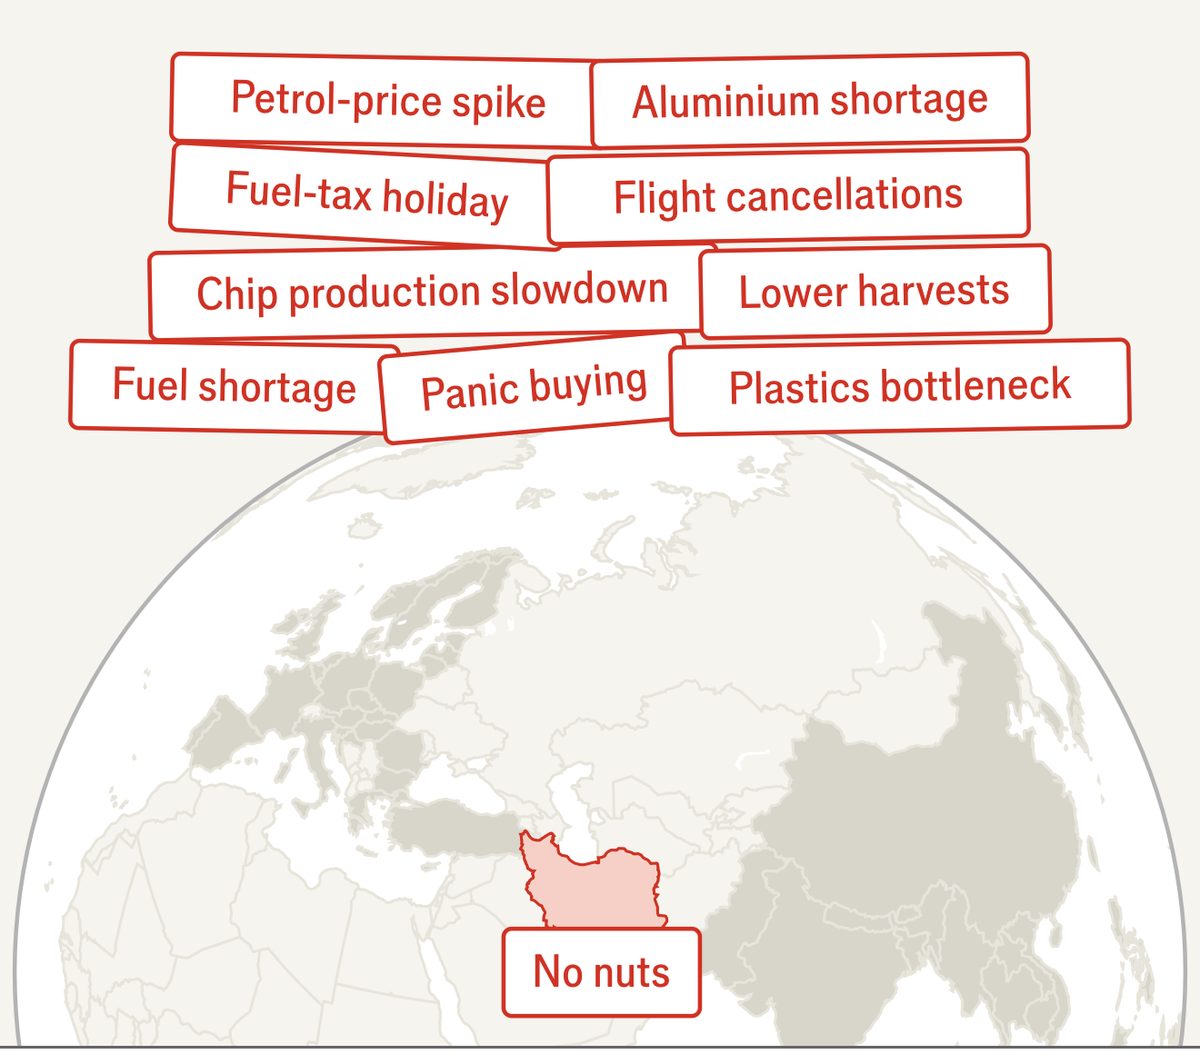
Even pistachio prices are going nuts. Iran is responsible for roughly one-fifth of the world's pistachio supply, and prices were already elevated from the Dubai chocolate craze. With supply choked through Hormuz, prices reached $4.57 per pound in March, an eight-year high. The Economist's panel of disruptions also tracks petrol-price spikes, fuel shortages, plastics bottlenecks, aluminium shortages, chip-production slowdowns, lower harvests and flight cancellations. The list of things going up because of Hormuz is longer than anyone wants to track. Source: The Economist.
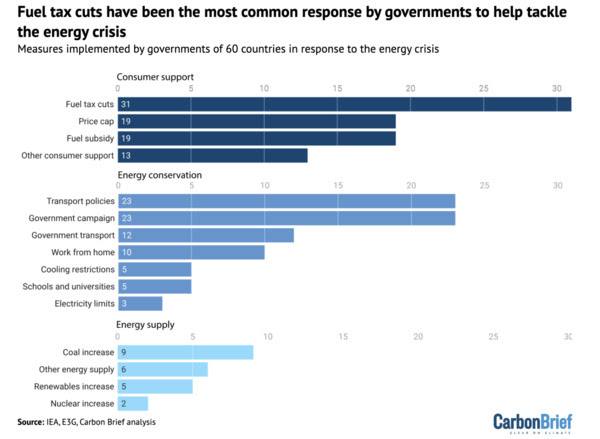
How 60 nations responded to the energy crisis. A Carbon Brief tally maps the policy responses across price caps, fuel subsidies, cooling restrictions and remote-work mandates. Nine countries, including South Korea, Germany and Japan, are leaning more heavily on coal in the short term. Myanmar introduced alternate-day driving rules. Spain unveiled a $5.8 billion aid package for households and energy-intensive industries. India, where up to 90% of crude is imported, is accelerating renewables to reduce future exposure. See the full Carbon Brief analysis. Source: Carbon Brief.
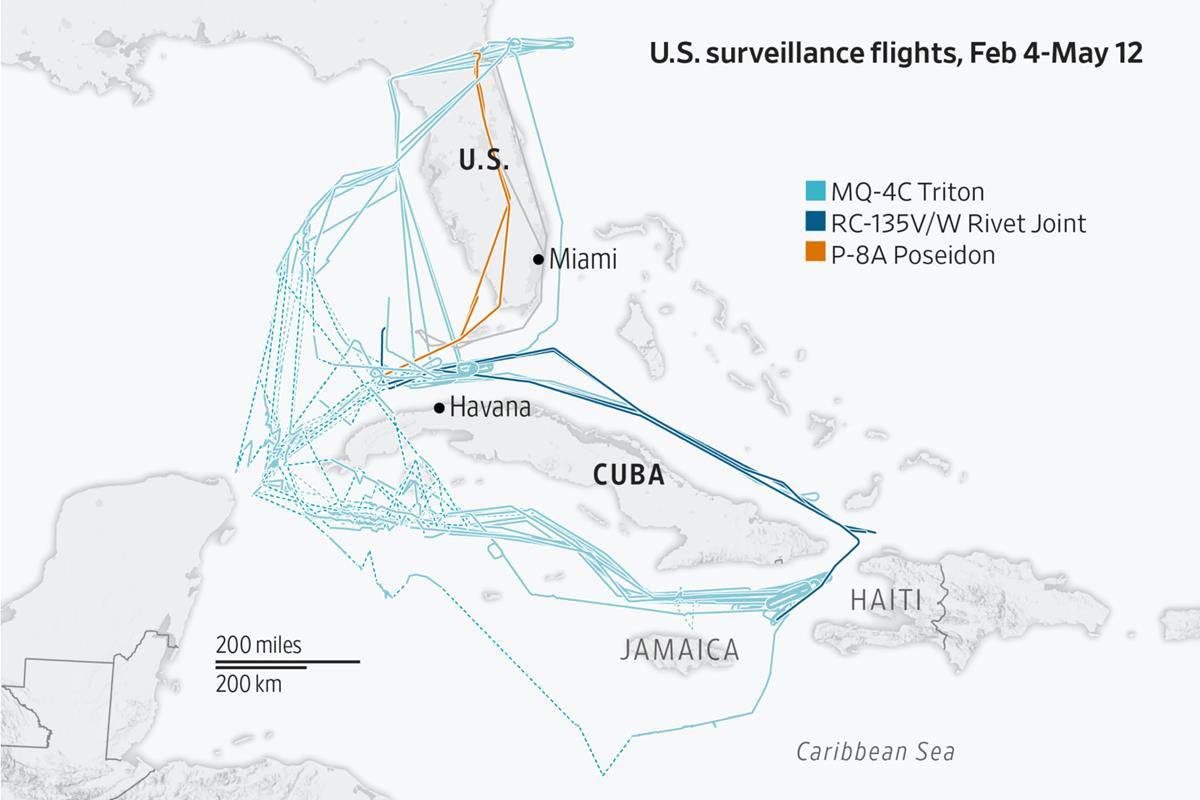
US military aircraft circling Cuba since February. WSJ-tracked flight data shows reconnaissance and intelligence aircraft have spent more than 150 hours over the island since February 4, as Trump ramps up pressure on the regime. The cadence mirrors the surveillance pattern over Venezuela last year before the operation to capture Maduro. Cuba is not the headline this week, but the pattern is the tell. See the WSJ piece for the full flight map. Source: The Wall Street Journal.
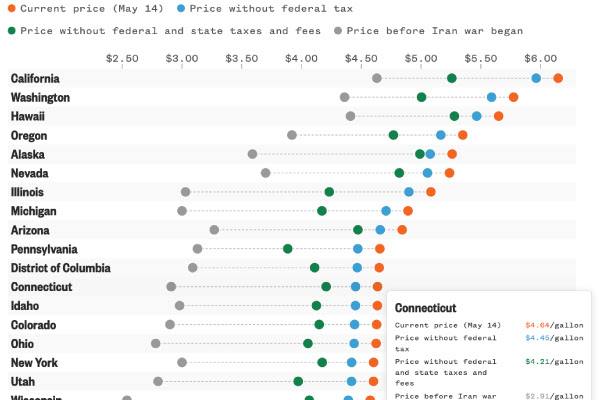
The federal gas tax is on Trump's hit list. An average of 51 cents per gallon at the US pump goes to state and federal taxes and fees, with the federal share accounting for 18 cents. The chart maps the state contribution, the highest band on the West Coast and the lowest in the Gulf states. Removing the federal cut is the proposal under consideration, the populist sweetener for a midterm calendar that grows hotter as inflation does. See the NBC News map for the state breakdown. Source: NBC News.
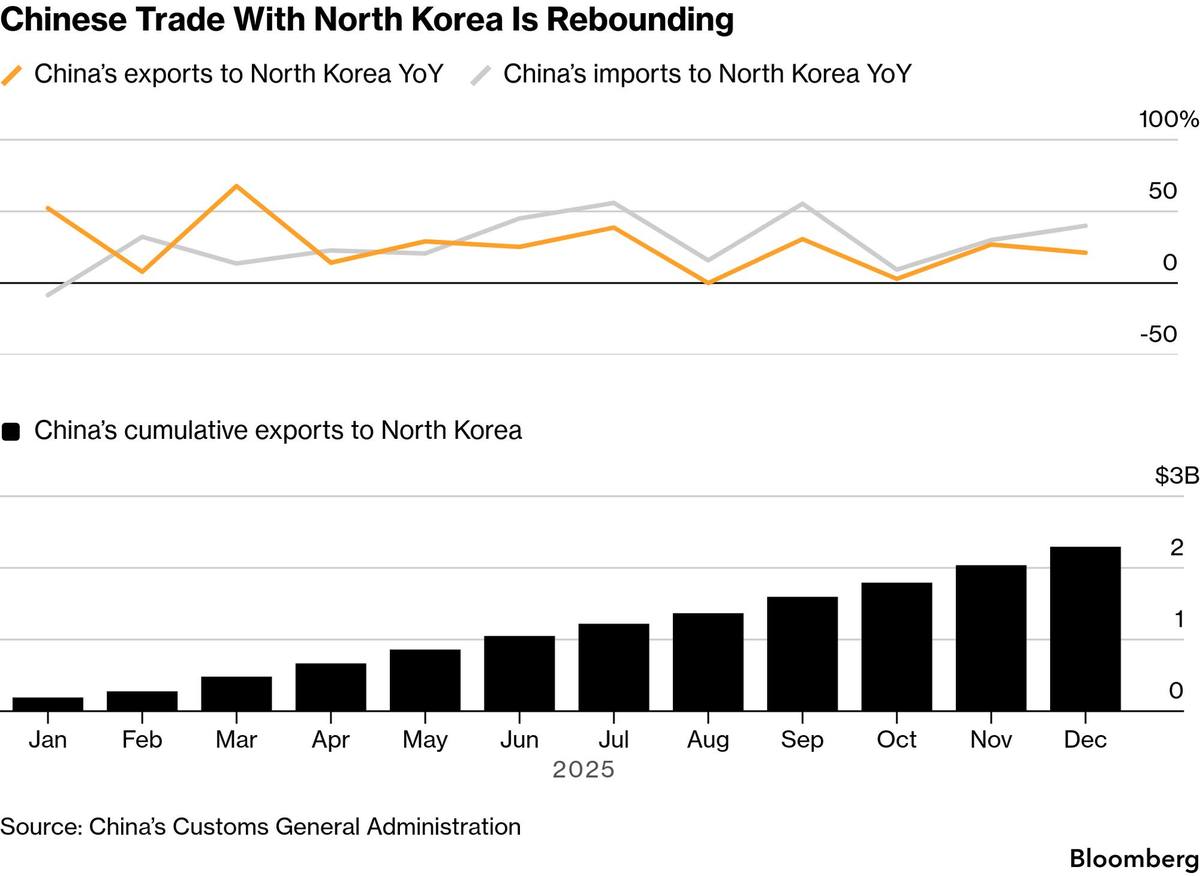
Xi visits North Korea, reportedly as early as next week. It would be his first trip abroad this year, and his first to Pyongyang in years. Beijing wants to be seen as the broker who can still talk to everyone in an increasingly fragmented world. The visit will also cover the bilateral trade that has become Pyongyang's economic lifeline against the nuclear sanctions. The geography of the Trump-Xi handshake last week extends north this week. Source: Bloomberg.
Turnaround Tuesday
Consumer Confidence is the US morning anchor, the Conference Board print expected to slip to 92.0. The Quad foreign ministers meet in New Delhi with the Middle East crisis on the same agenda as Indo-Pacific security. Trump heads to Walter Reed for medical and dental checkups. Texas runs its Republican primary runoff. The Treasury sells $69B of 2-year notes. Earnings begin to wind down with Xiaomi and ONGC in Asia.
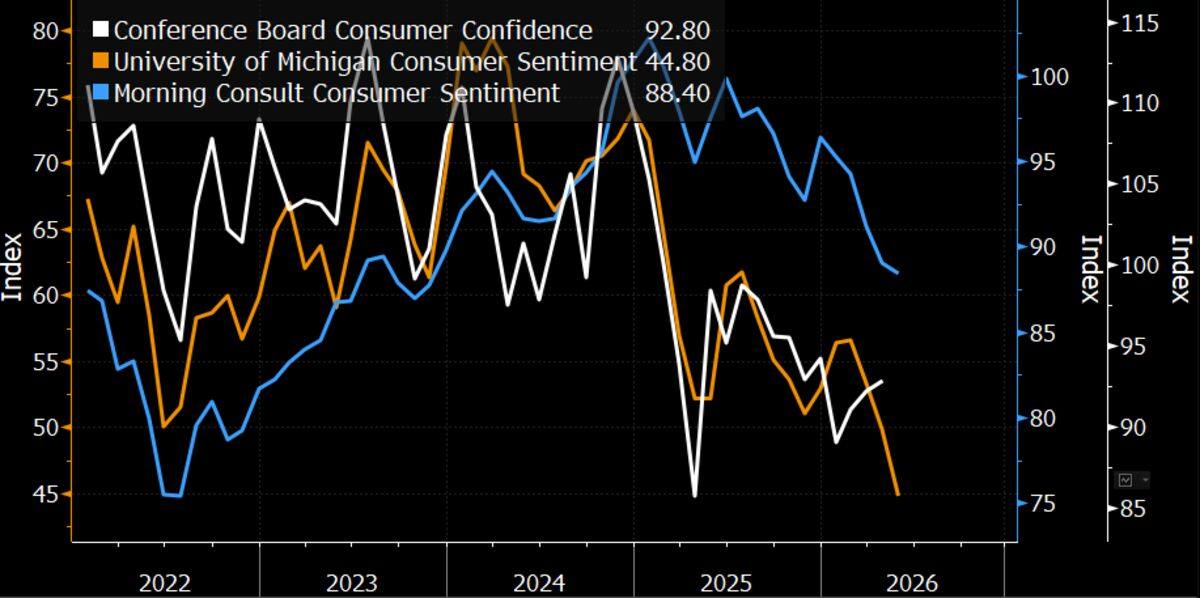
US consumer confidence weakening in May. UMich and Morning Consult sentiment readings both fell sharply, dragged by gasoline, the war and persistent inflation. The Conference Board print is expected at 92.0, a modest decline from 92.8. The board's measure leans more on jobs and income, so a smaller drop than UMich is the base case, but the trend is the same. The signal underneath the headline is the divergence between household balance sheets and the equity tape still printing fresh records. Source: Bloomberg.
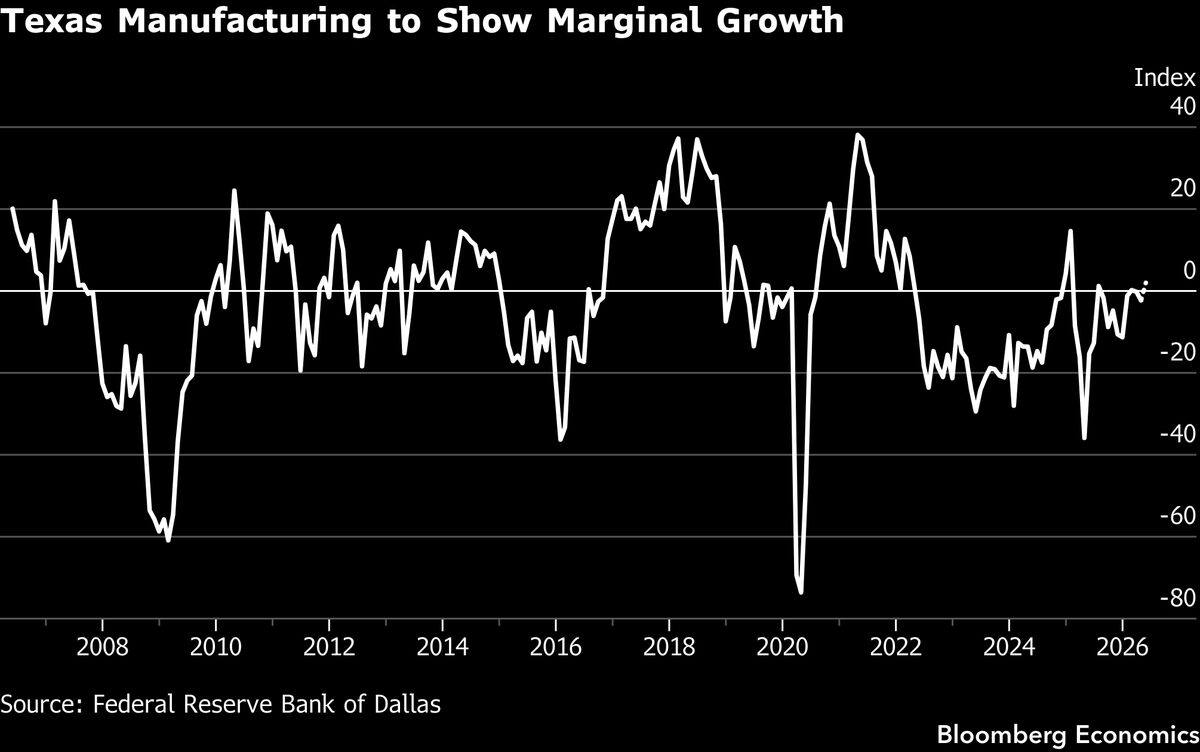
Dallas Fed manufacturing likely turned modestly positive in May, the general business index lifting to 2.0 from -2.3 in April. Production, new orders and shipments all gained in April, and the early indicators point to follow-through. The energy basin states are absorbing the war shock from both sides, higher production margins offset by higher input costs. The price components stay elevated; the activity components are quietly improving. Source: Bloomberg.
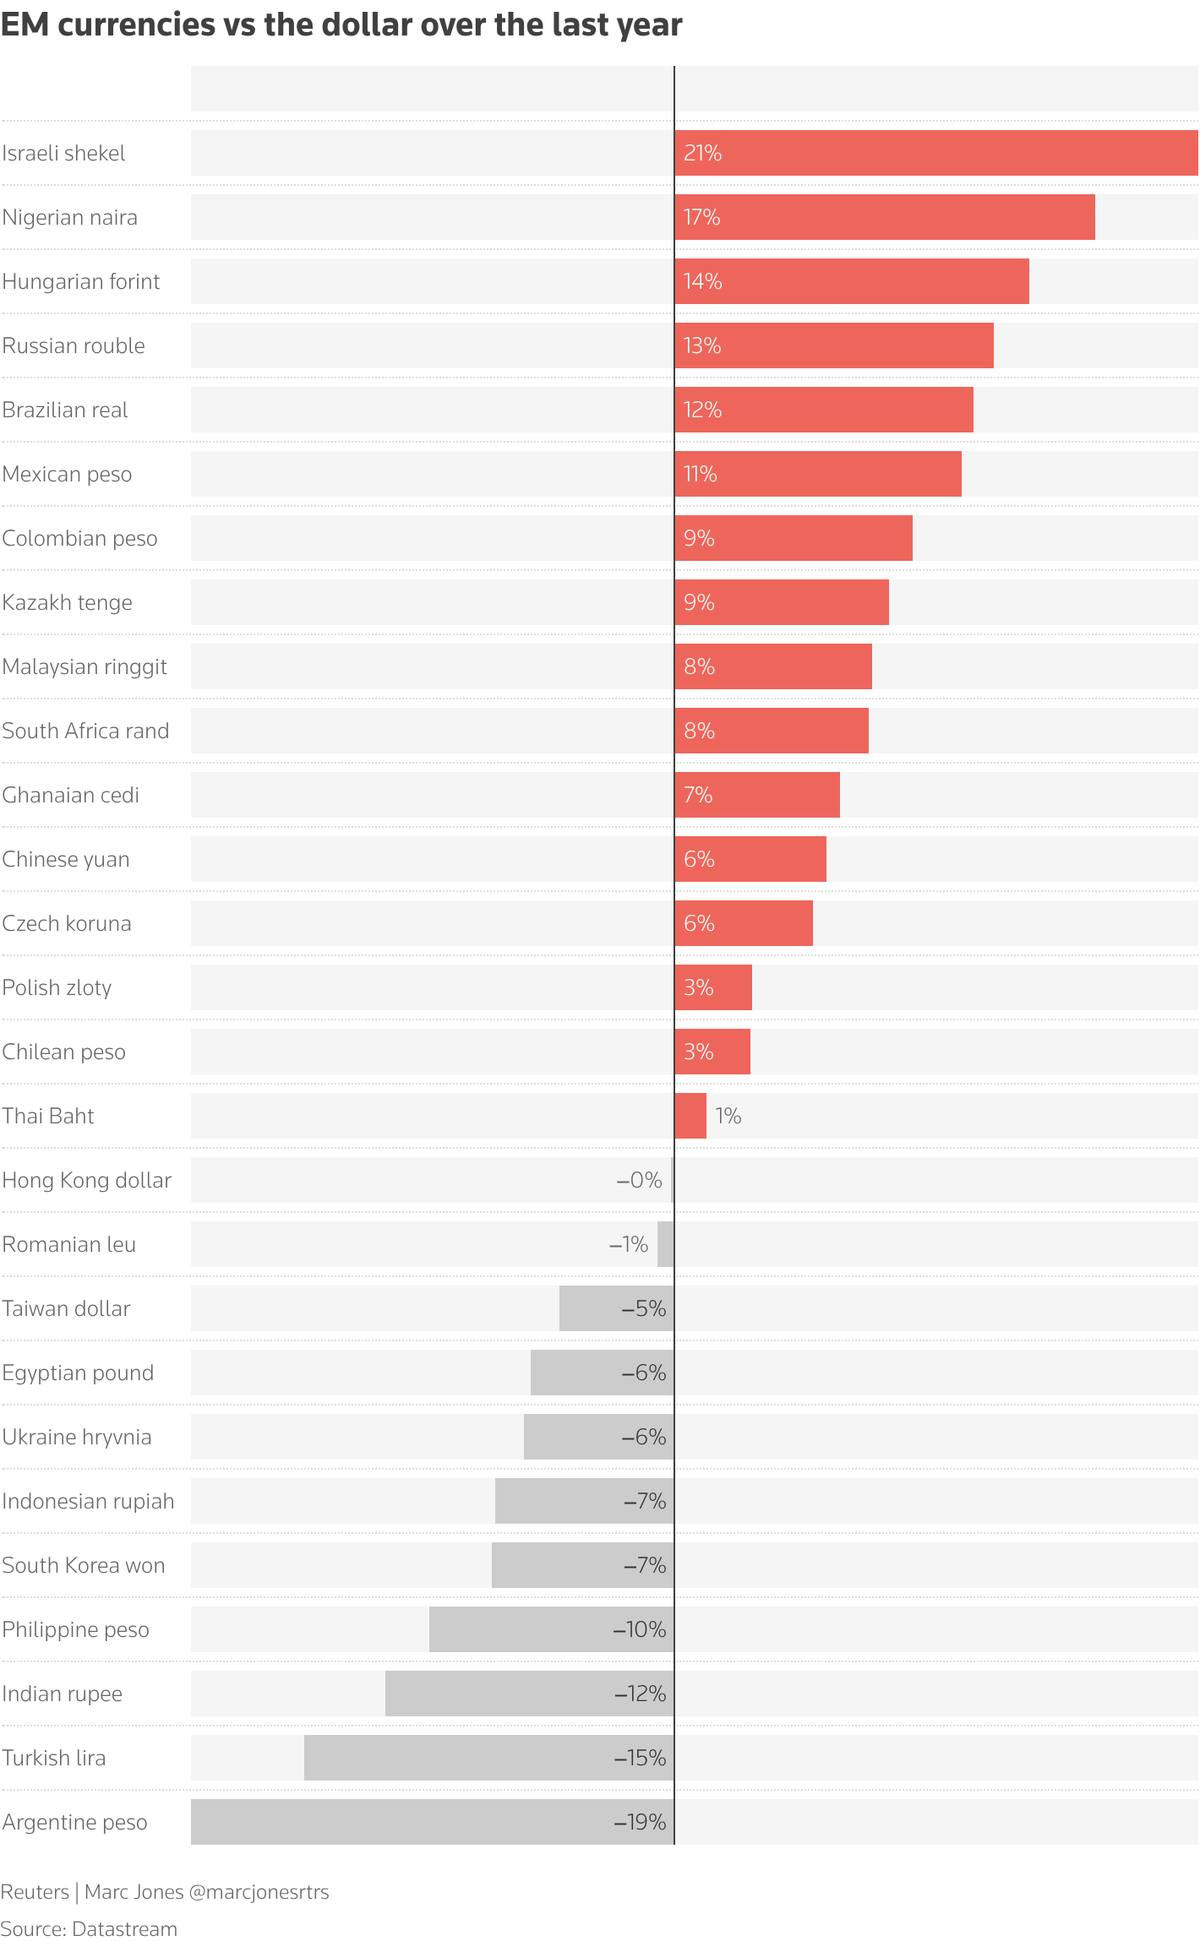
Israel's shekel up 20%, the rest of EM down. The shekel has surged over 20% in the past year as the war's pricing-in of victory and the surge in tech exports lifts the currency. Meanwhile Indonesia, India, Turkey and Argentina have seen sharp currency falls as their oil import bills balloon. Turkey is back on the worry list after a court effectively ousted opposition leader Ozgur Ozel; the central bank has already sold billions in forex defending the lira. The currency map is the inflation map, drawn in real time. Source: Reuters.
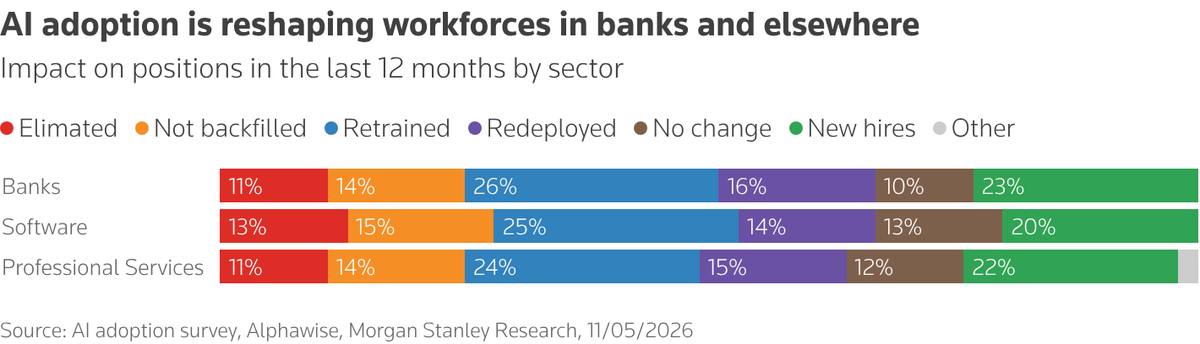
The AI impact on workforces by sector. Standard Chartered says it will eliminate almost 8,000 jobs by replacing what its CEO Bill Winters called "lower-value human capital" with technology. JPMorgan's Dimon and HSBC's Elhedery echoed the warning. A Morgan Stanley survey found 11% of positions at banks had already been eliminated, with 14% not backfilled. The white-collar floor is being repriced quietly, and the boos at three commencement speeches this month say the next generation has noticed. Source: Reuters.
Watershed Wednesday
Asia opens busy. Australia CPI before the RBNZ holds at 2.25% with revised inflation projections; China April industrial profits should push the YTD pace to 16.4% as factory-gate prices catch the energy shock. The BOJ-IMES Conference begins in Tokyo with Ueda and Kashkari on the panels. France consumer confidence. Salesforce after the US close, the late-season AI earnings marker, and Fed Cook on AI at Stanford the same day, with Microsoft’s Global AI Diffusion read as the backdrop. The Treasury sells $70B of 5-year notes.
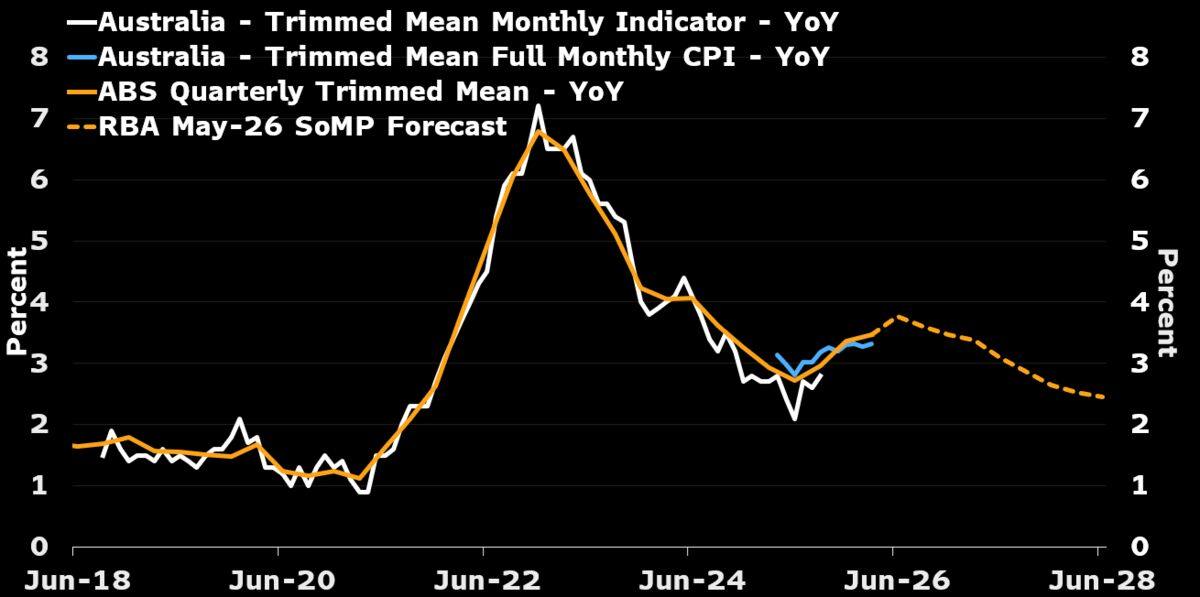
Australia April CPI likely eased to 4.0% year-on-year from 4.6%, fuel-tax rebates and currency strength cushioning the energy shock. Trimmed mean is expected at 3.4% from 3.3%, still above the RBA's 2-3% target band. Substantial fuel-tax relief and a stronger Aussie pushed pump prices back toward pre-war levels, trimming about 20 basis points off the headline. The relief is mechanical and temporary. The June RBA call leans toward a hold, but the second half repricing is alive. Source: Bloomberg.
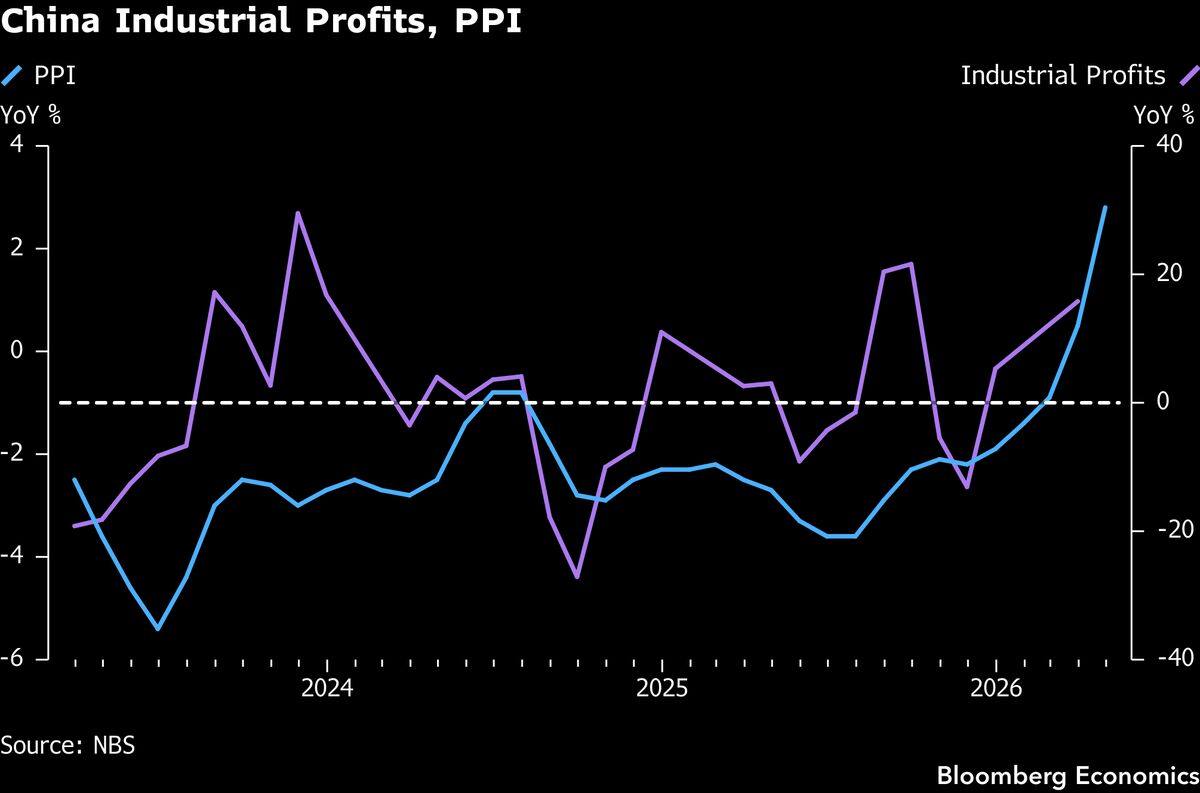
China April industrial profits likely accelerated to about 19% year-on-year, with the YTD pace lifting to 16.4%. Factory-gate prices jumped on the energy shock, PPI inflation hitting 2.8% year-on-year from 0.5%, the highest in nearly four years. Strong tech demand and resilient export orders supported earnings; domestic activity remains a drag. The split between profits and activity is the China-First read in one number — capacity utilisation rises while the West absorbs the inflation. Source: Bloomberg.
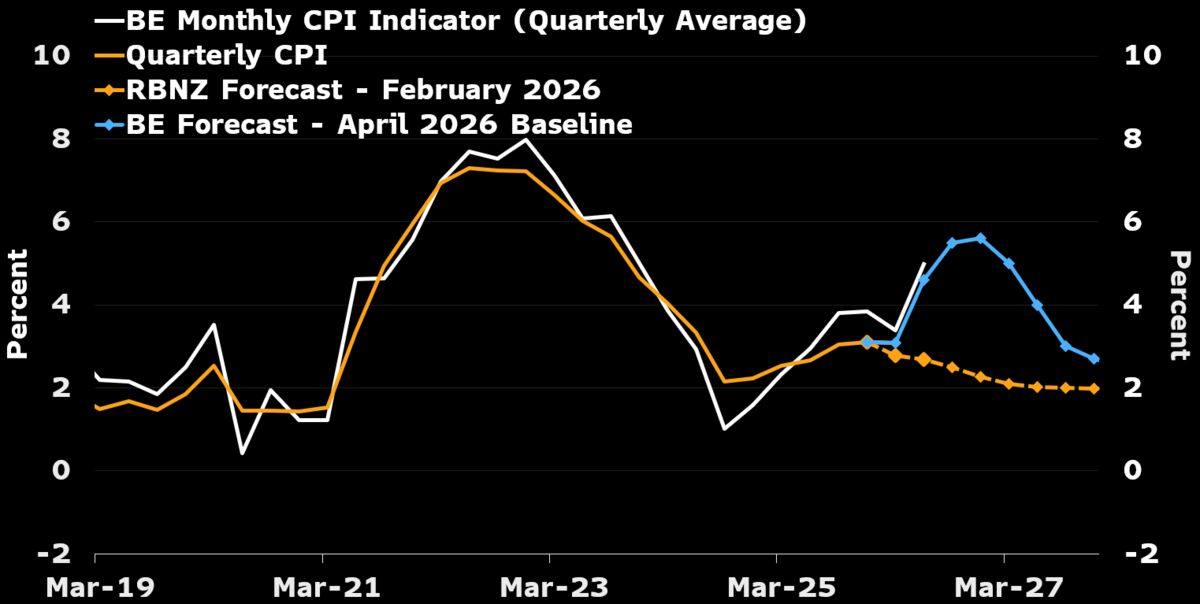
RBNZ to hold and revise the inflation outlook on the oil shock. The May 27 decision is expected to keep the Official Cash Rate at 2.25%, but the revised projections will point to an earlier resumption of hikes. The Breman playbook is to look through first-round energy effects and focus on inflation expectations, which fell in the latest survey. The risk is that the tightening signalled in the OCR path hits the recovery before it begins. Kiwi rates curve is the most sensitive G10 curve to this print. Source: Bloomberg.
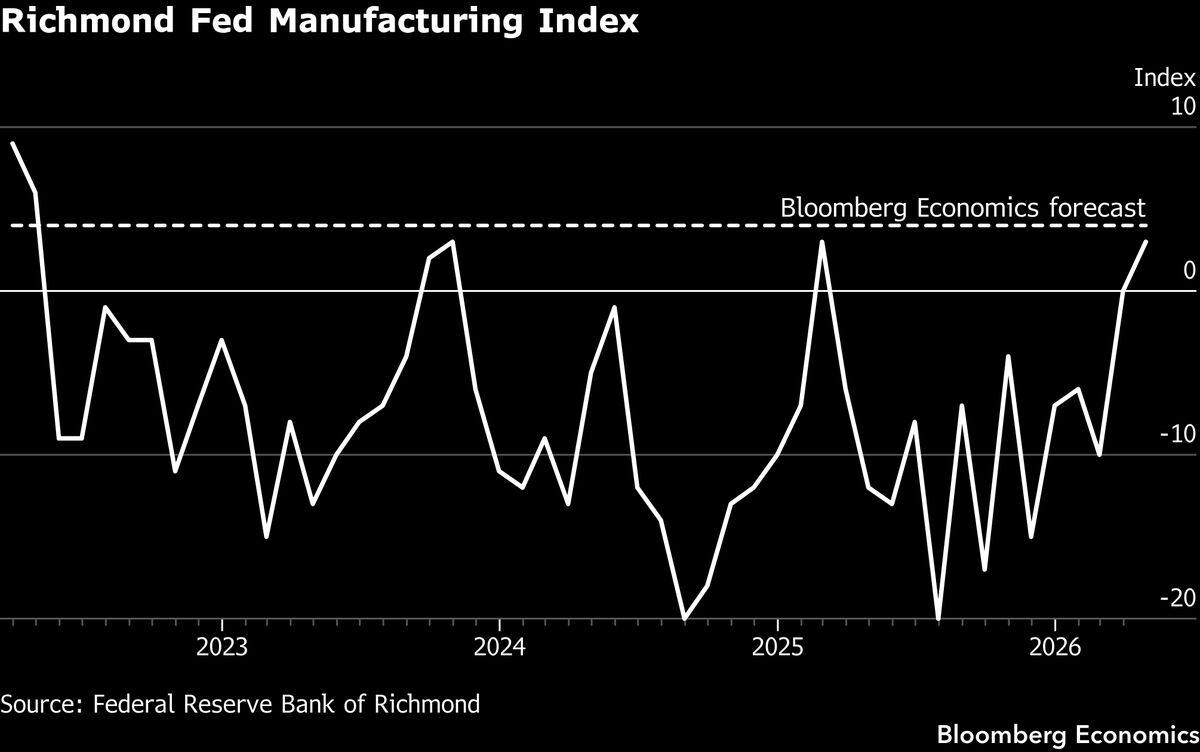
Richmond Fed manufacturing prices paid stay elevated. The composite likely ticks up to 4 in May from 3 in April, the second positive print since February 2025 and the highest since April 2022. Forward-looking gains in new orders and Local Business Conditions point to the modest follow-through. The price components remain the more important signal — input costs are still rising and firms' ability to pass them through is increasingly limited. The Fed's regional surveys are flashing what PCE confirms on Thursday. Source: Bloomberg.
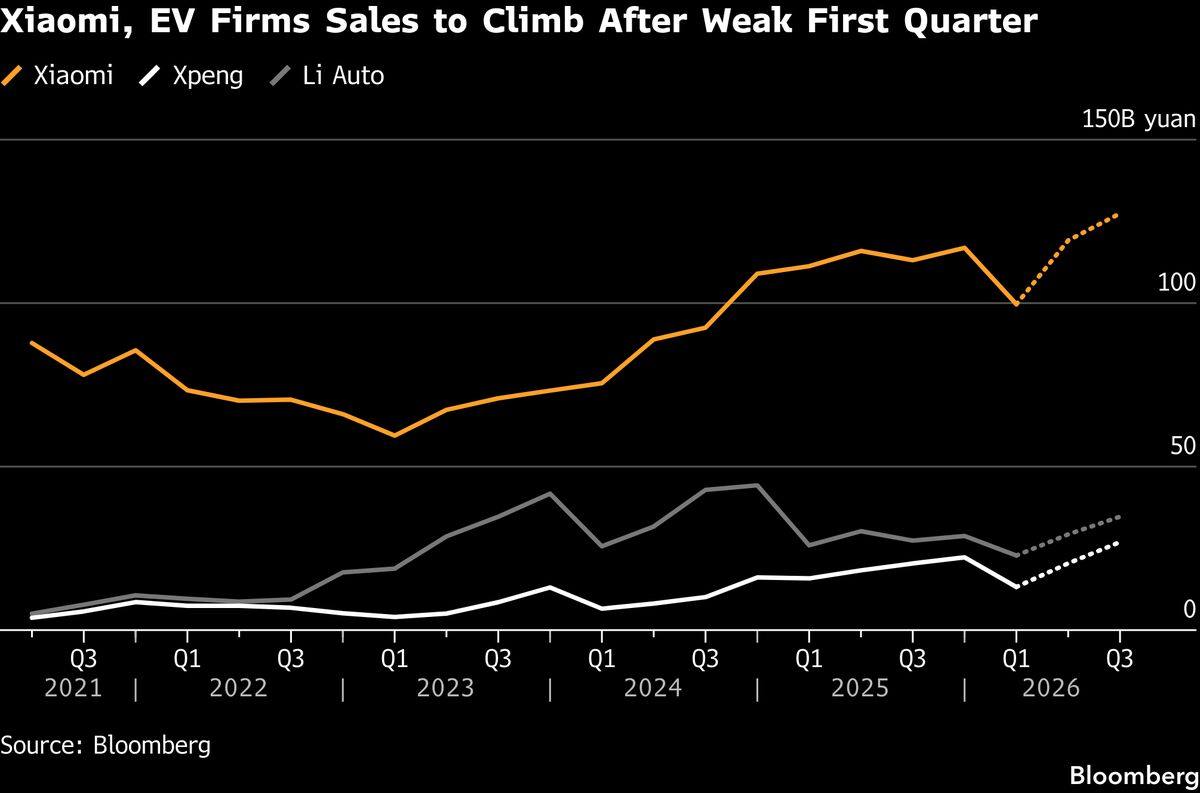
China EV makers head into earnings with margins squeezed. Xiaomi, Xpeng and Li Auto are set to report margin pressure as price competition and rolled-back subsidies bite. Xpeng's vehicle gross margin is trailing Xiaomi, Li Auto and Nio, which sell more expensive models. The new catalysts to watch are Xiaomi's YU7 GT launch and Xpeng's newly unveiled robotaxi. Counterintuitively, high oil prices boost the EV story, even as the financial print this quarter is unkind. Source: Bloomberg.
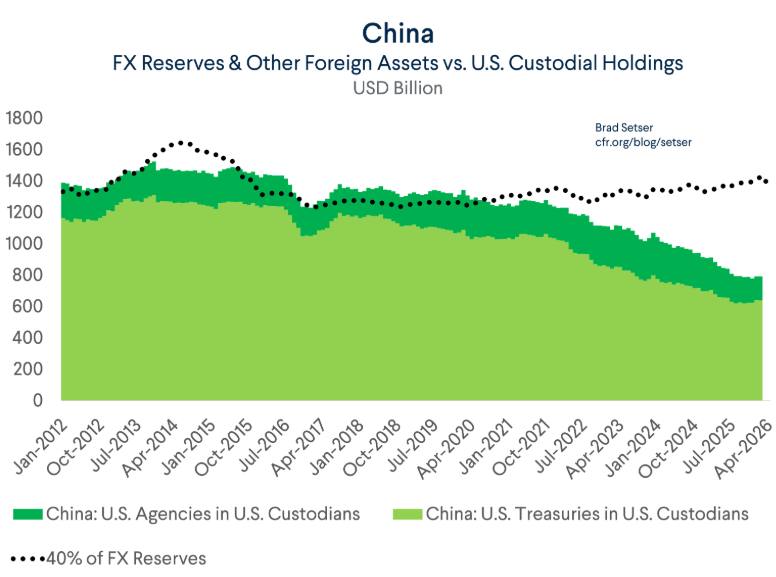
Finding China in the US TIC data. Since the G-7 immobilised Russia's reserves in early 2022, China's holdings have appeared to fall in the US data, but the move is not necessarily a diversification out of the dollar. China can hold US dollars indirectly through non-US custodians; Belgian Euroclear holdings, where China had been visible, have also dropped sharply as the sanctioned-central-bank arrangement turned punitive. Beijing's dollar reserve share was already low, at 55%, before Russia. The story is less de-dollarisation than re-custodial routing. See the full Brad Setser blog for the data behind the headlines. Source: Brad Setser.
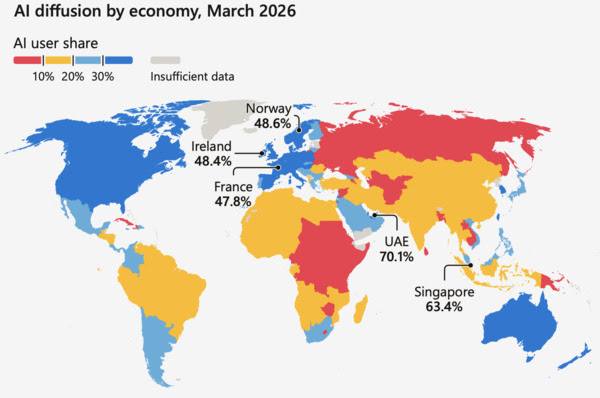
Microsoft's Global AI Diffusion Q1 2026. The report tracks AI adoption across 146 countries. In Q1 2026, 17.8% of the world's working-age population used AI for at least 90 minutes per month, with the UAE leading globally at 70.1% and Singapore second at 63.4%. The US ranks 21st worldwide at 31.3% despite being the global tech leader. Asia accounts for 10 of the 15 fastest-growing AI markets since H1 2025, led by South Korea, Thailand and Japan. The Singapore reading is the policy story — six months of free premium-AI access via the government's training programme. See the full Microsoft report. Source: Microsoft Research.
Special — Why the Belly Catches Up
The macro setup ahead of PCE Thursday in three charts. The textbook curve scenario after 2022 was a straight inversion driven by inflation alone forcing the Fed’s hand. The 1970s playbook is different: when the Fed cannot cut despite weakness because inflation will not allow it, term premium piles into the belly of the curve and steepens it where the Fed dare not move. The 2-to-5-year sleeve carries the catch-up risk that the long end has been pricing for months.
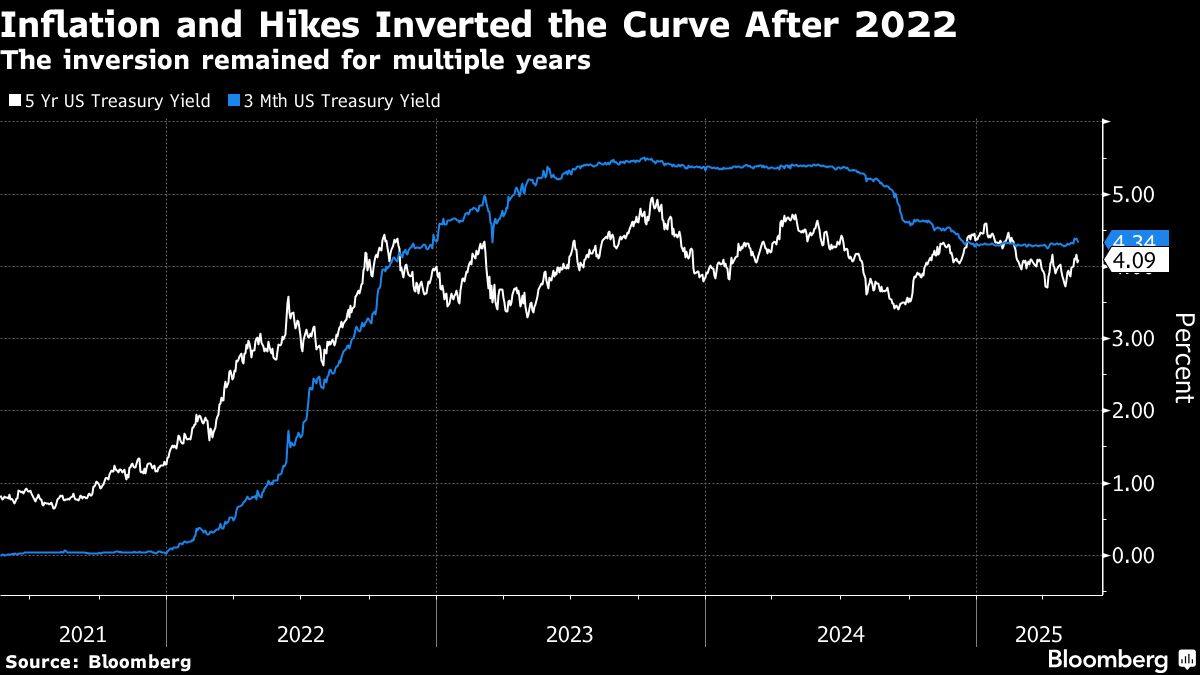
Why 2026 rate hike bets hurt the belly the most, the baseline. When inflation pressures alone drive the curve, late-cycle rate hikes lift the short end and the curve inverts ahead of recession — exactly what played out after 2022 even without the recession arriving. The chart is the textbook scenario. It is not the scenario priced now. Source: Bloomberg.
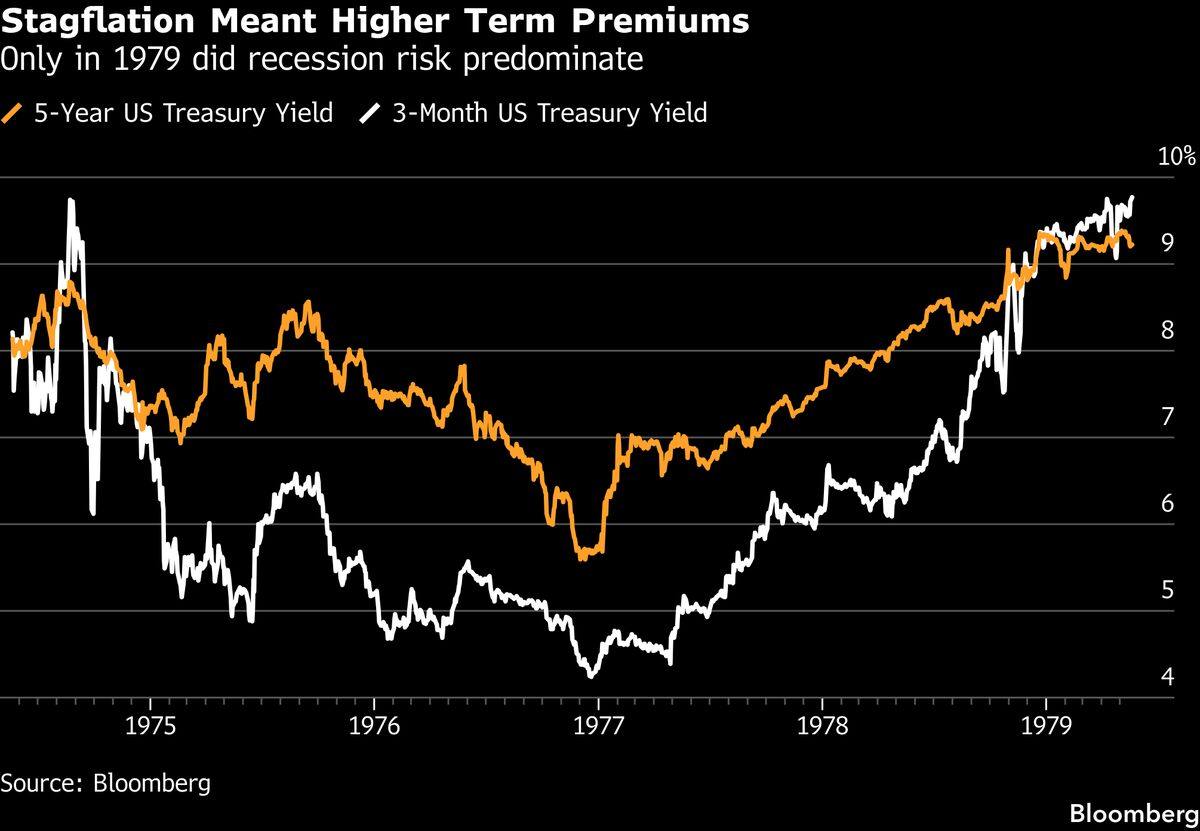
The 1970s playbook, when the belly takes the term-premium hit. During the OPEC shock, the Fed stayed behind the curve to avoid triggering a recession. Inflation and inflation expectations kept rising, term premium piled into the belly, and the curve steepened from 3-months through 5-years even as real growth held up. The curve did not flatten until rates hit 9% in 1979. The middle of the curve is where the catch-up happens when the Fed cannot cut. Source: Bloomberg.
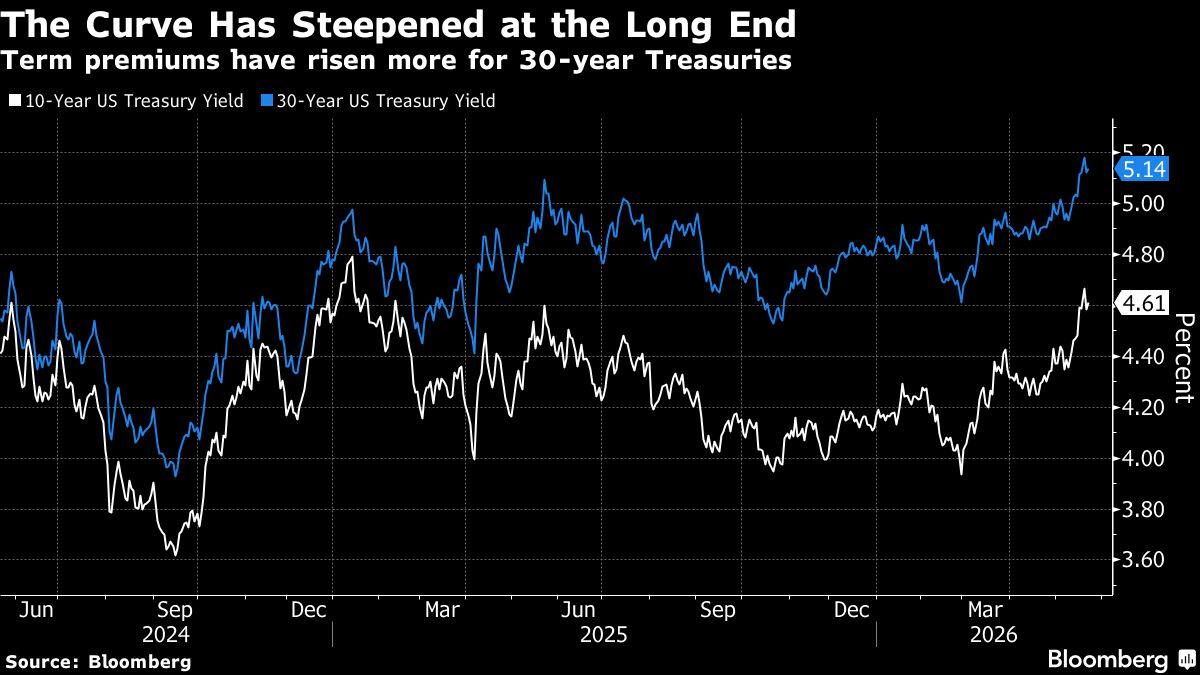
The asymmetric trade priced now. The Treasury curve has steepened sharply from 10 to 30 years, but investors have stayed cautious about extending duration. With the CBO 2026 deficit at $1.9 trillion and AI capex projected at $800 billion in 2026, the stimulative flow keeps the recession at bay while the inflation print runs hot. PPI at 6%, CPI at 3.8%, core PCE at 3.5%, and the Fed's latest statement still calls a cut the next move. The risk is that term premium catches up in the 2-to-5-year belly, the slice that takes the term-premium hit when the Fed pulls its punches. Source: Bloomberg.
TP Thursday
The PCE versus everything day. April PCE on the same morning as the Q1 GDP second estimate, April durable goods, jobless claims and new home sales. The BOK holds at 2.5% with hawkish guidance, South Africa hikes 25bp to 7.00%, the ECB publishes the April account that likely shows the Council closer to a June hike than the market is positioned for. Lagarde in Cambodia, Reykjavik with Williams and Bailey, Putin at the Eurasian Forum in Astana, Dell after the close. Underneath the macro tape, the hedging desks have quietly pushed hyperscaler CDS volumes to multi-year highs while the data-centre utility bill keeps growing. Take profit on the binaries that have run, hold position into the prints.
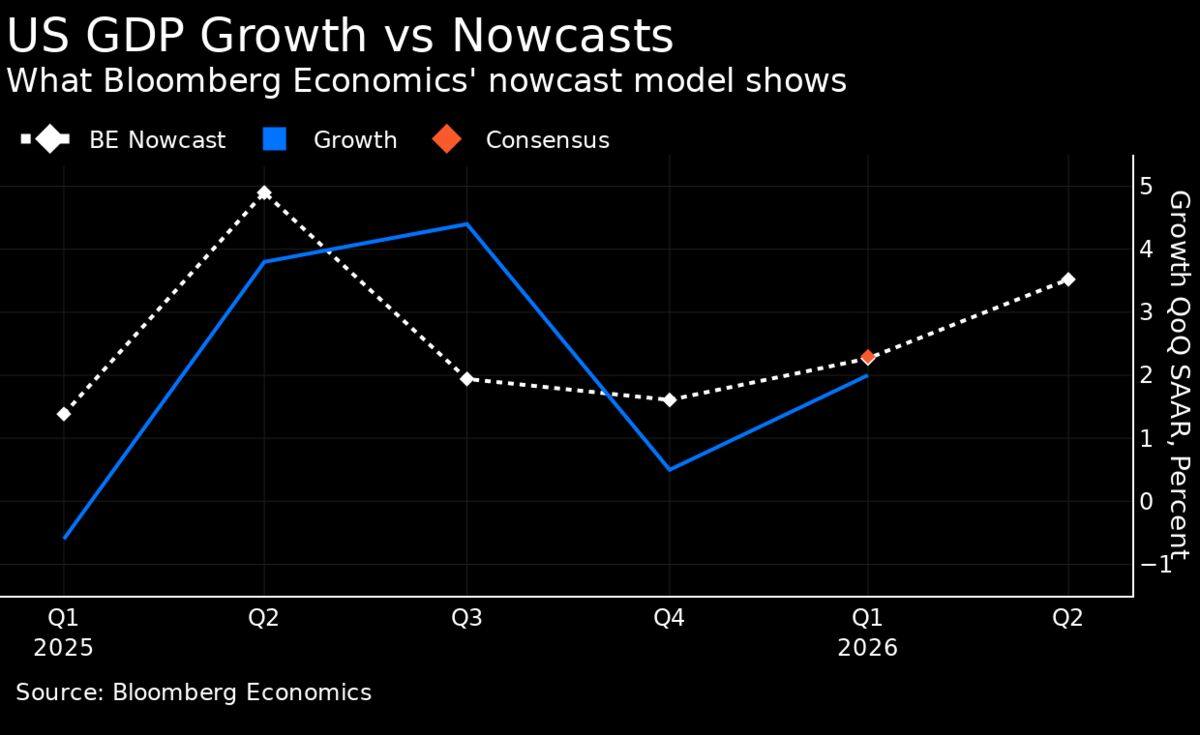
Q1 GDP second estimate likely revised up to 2.1% from the 2.0% advance read, with consumer spending and construction picking up some of the upside. Industry-level data implies an even firmer 1.7% annualised pace, although industry data tends to overstate growth versus the expenditure measure. The Q2 nowcast still points to growth above Q1. The print confirms an economy re-accelerating in the face of every reason to slow, which is the framing for the PCE that lands the same morning. Source: Bloomberg.
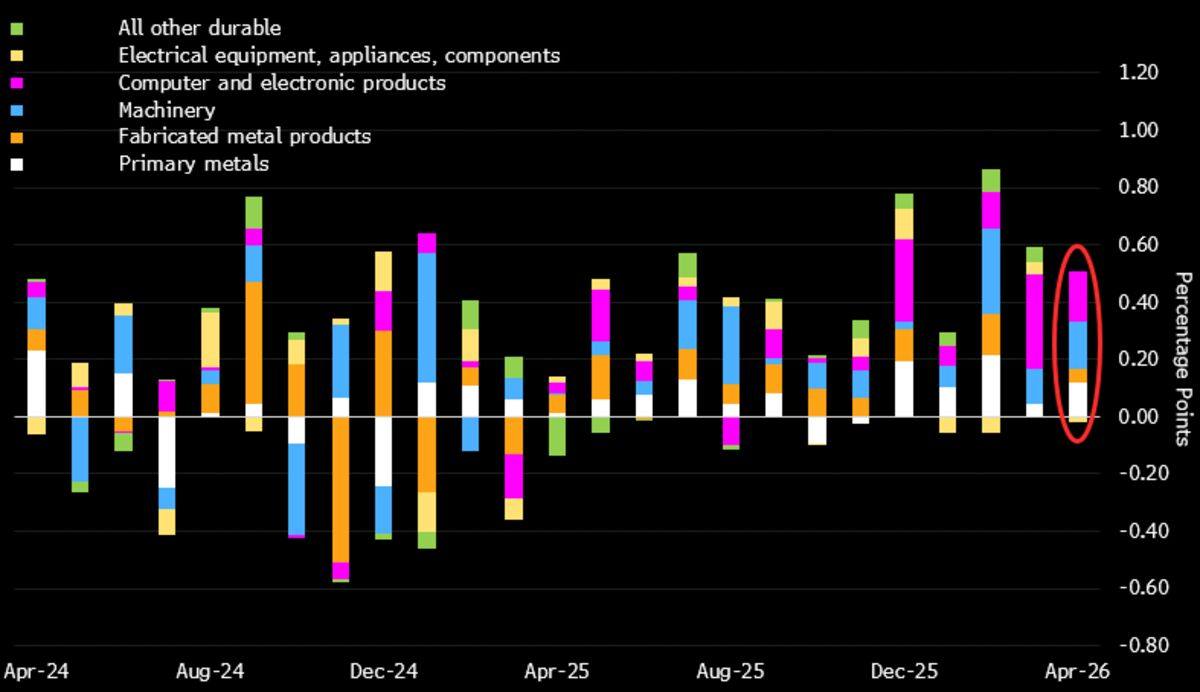
April durable goods orders +3.0% on a Boeing-driven surge, with 136 orders versus 33 in March. Stripping out transport, orders rise 0.4%, supported by computers and electronic products tied to the AI build-out. Memory-chip prices have surged with the AI data-centre cycle, lifting nominal orders even as physical capacity stays tight. The chart's three-month moving average shows computers, machinery and metals leading the gains, the inflation-meets-capex picture in one frame. Source: Bloomberg.
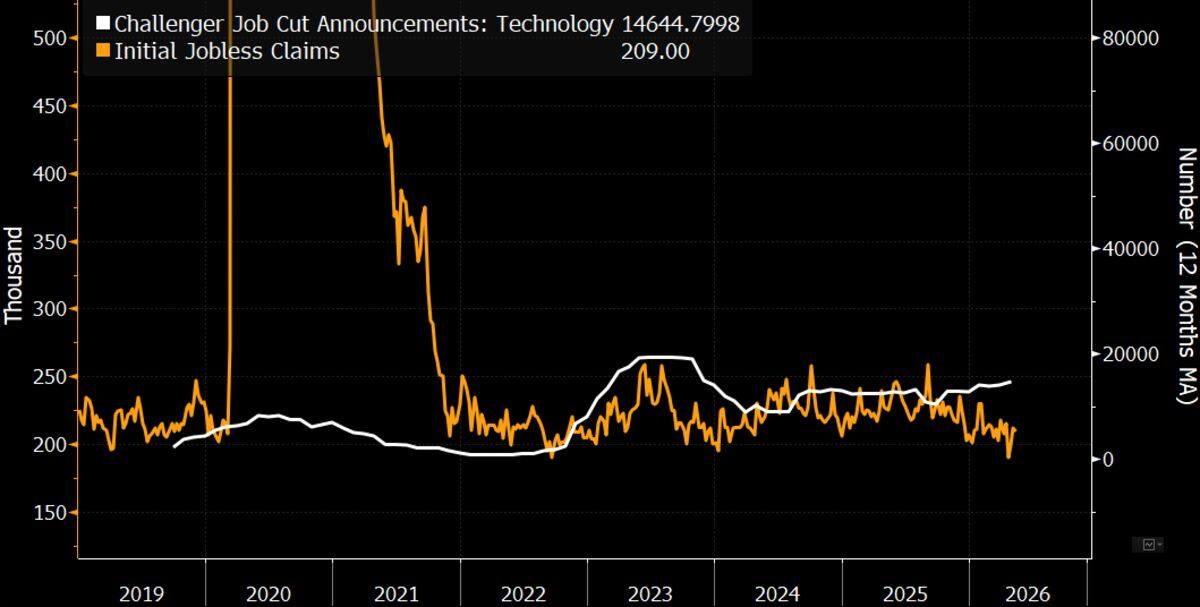
Initial jobless claims hold near 210,000, AI rewires the workforce. The subdued claims level points to generally stable labour conditions even as AI-driven automation reshapes demand. Firms are opening roles complemented by the technology and eliminating roles that can be automated. The chart's overlay of Challenger AI-related job-cut announcements alongside claims shows the puzzle: the headline level stays calm, the composition does not. The dataset most central banks read for slack is hiding the rotation underneath. Source: Challenger / Department of Labor.
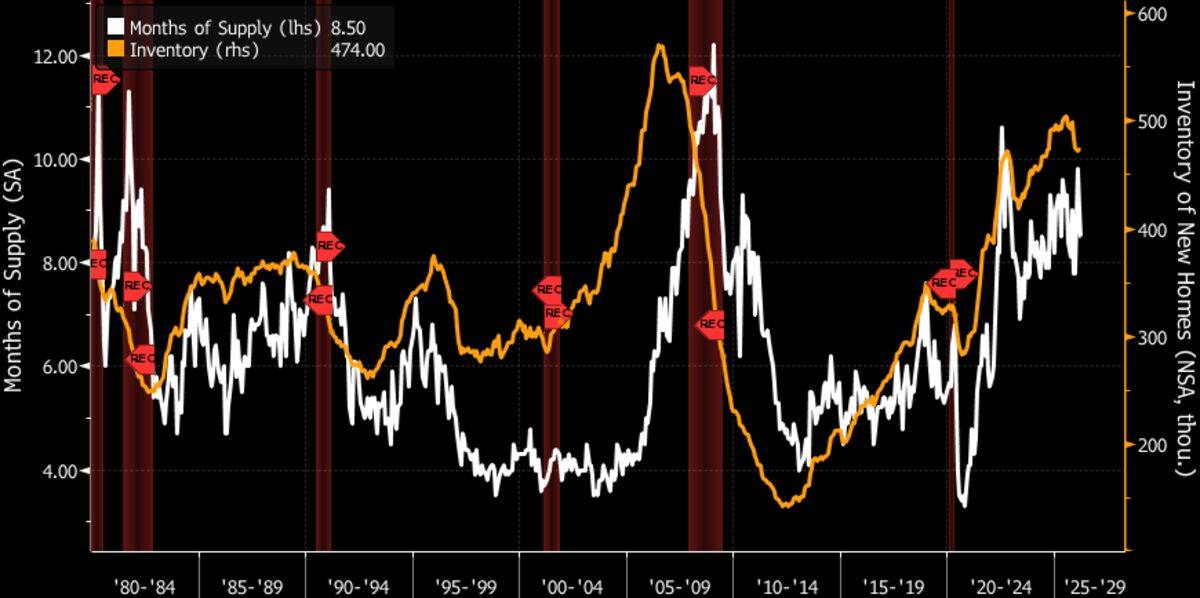
US homebuilder inventories are bloated, new home sales likely declined 4.7% to an annualised 650,000 pace. Higher mortgage rates and the affordability crisis are keeping buyers out, and homebuilder sentiment dropped further in April with builder traffic slowing. The build-up of single-family inventory pushes builders toward multifamily and toward price reductions that keep downward pressure on the median home price. Housing is the cleanest channel for the rates pass-through, and the channel is starting to leak. Source: Bloomberg.
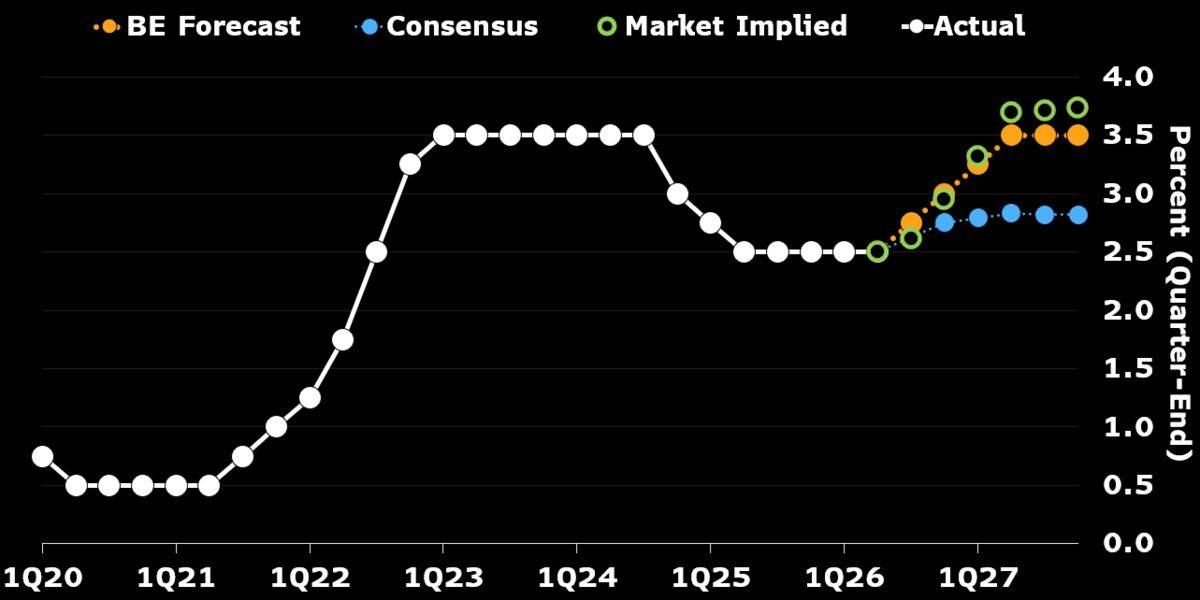
South Korea's BOK to hold at 2.5%, the guidance is the trade. Fuel-price caps have cushioned the inflation hit, giving the central bank room to wait, but Governor Shin Hyun Song is expected to signal greater concern over inflation risk and accommodative financial conditions. The base case is a 25-basis-point hike in 3Q, likely August, followed by another by year-end and two more in 2027. The terminal rate of 3.5% is the marker the swaps market has not fully priced. Source: Bloomberg.
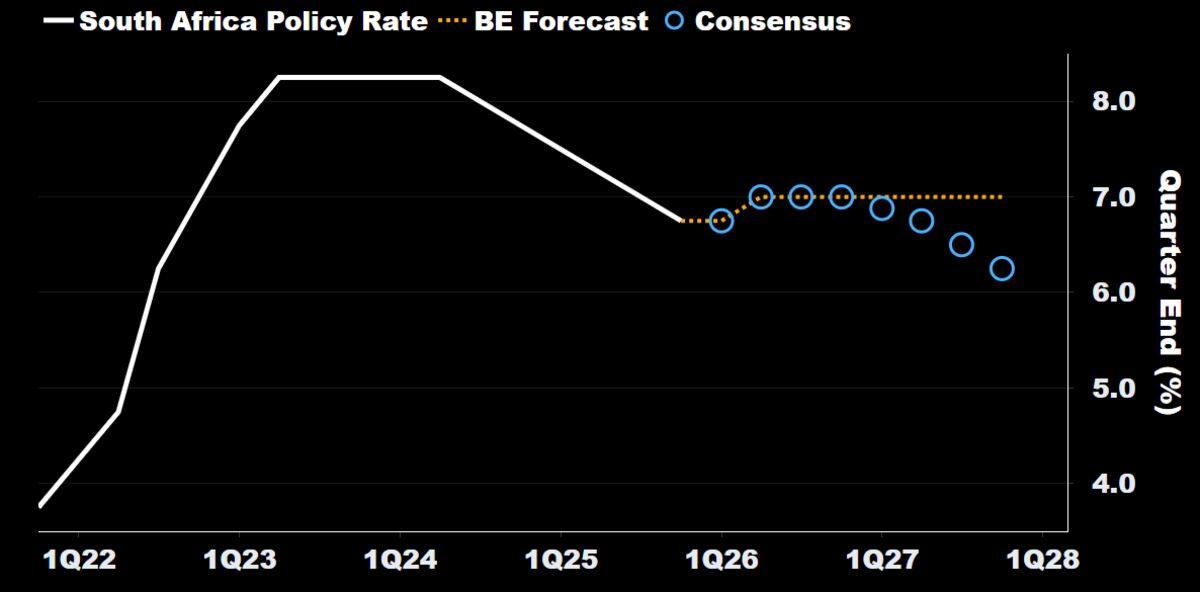
South Africa's SARB to hike by 25 basis points to 7.00% as the inflation pass-through spreads. April headline CPI jumped to 4.0% from 3.1%, lifted by transport inflation turning positive after three months of deflation. Core lifted to 3.6% from 3.2%, breaching the upper end of the 1-percentage-point tolerance band around the 3% target. The SARB moves before the global cycle does — the textbook EM response to an oil shock that keeps biting. Source: Bloomberg.
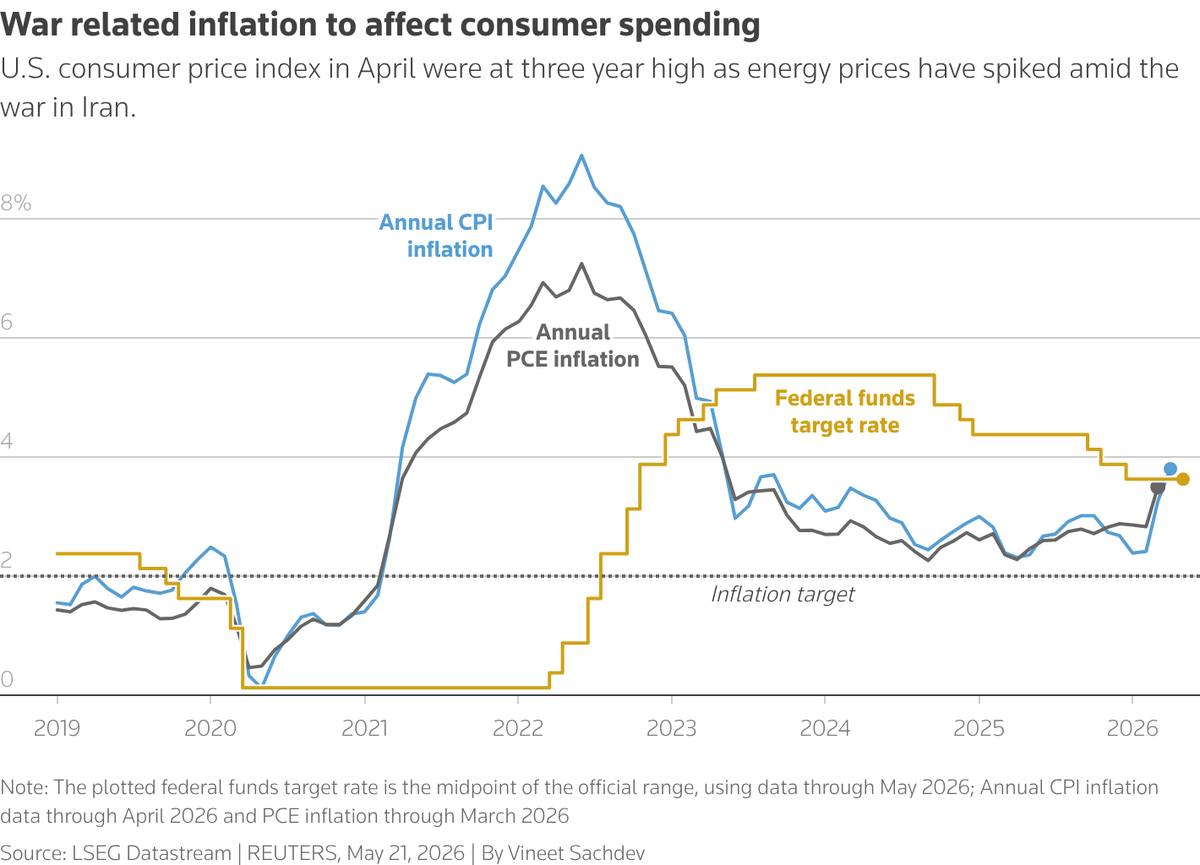
Fed funds vs the US PCE and CPI since 2019. Thursday brings the April PCE, the Fed's preferred inflation gauge. The recent measures showed high readings for consumer and producer prices as higher energy weighs. Investors will also pore over the Q1 GDP second estimate and the latest consumer confidence print. Corporate results from Salesforce, Best Buy and Costco shed more light on the AI trade and consumer spending as a robust Q1 earnings season winds down. The chart is the inflation gap the Fed has to close, or admit it cannot. Source: Reuters.
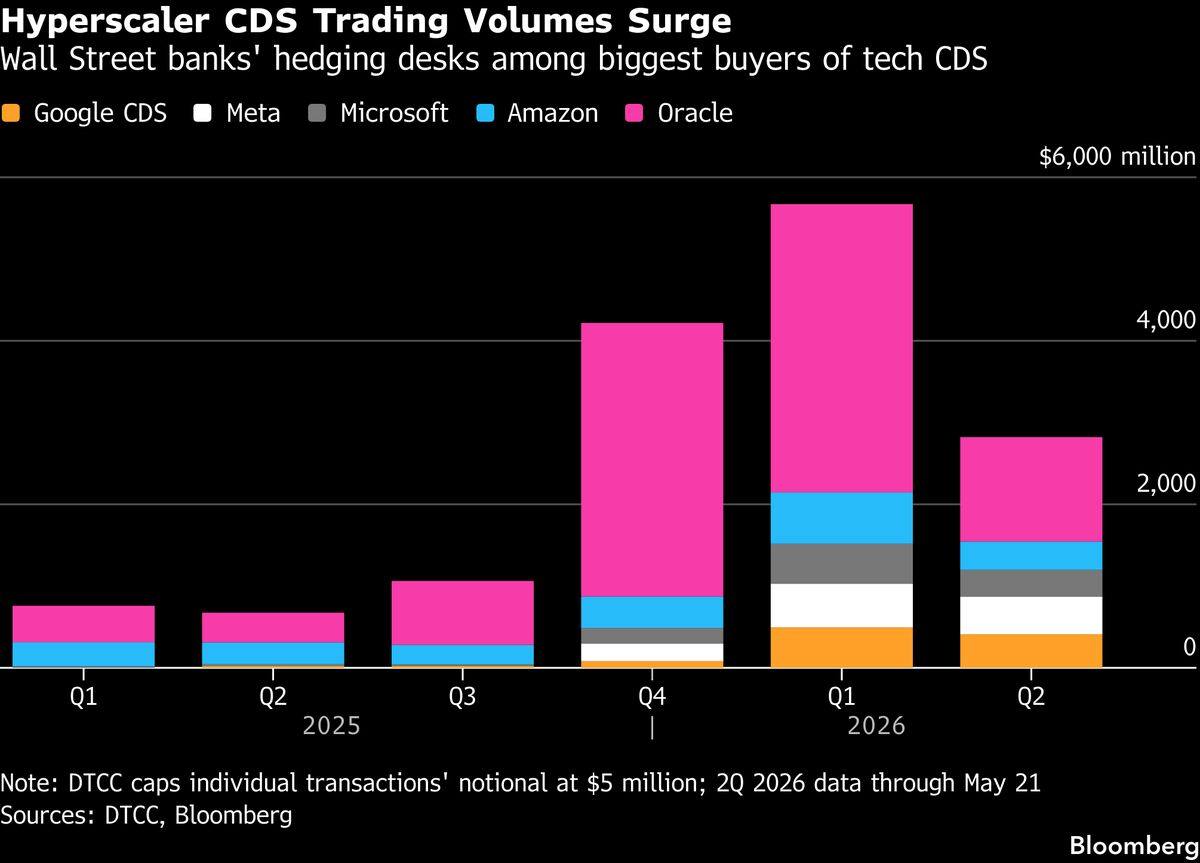
Wall Street is quietly hedging the hyperscalers. CDS trading volume on Google, Meta, Microsoft, Amazon and Oracle has surged from roughly $500 million in Q1 2025 to nearly $6 billion in Q1 2026, with Q4 2025 already over $4 billion. Oracle is the largest slice; Google and Meta now register a footprint that did not exist a year ago. The buyers are the banks' hedging desks. This is what hedging the Mag-7 capex story looks like in the credit market before the equity market notices it. The volume does not determine the outcome, it tells you how the credit professionals are positioning. Source: Bloomberg Credit Weekly.
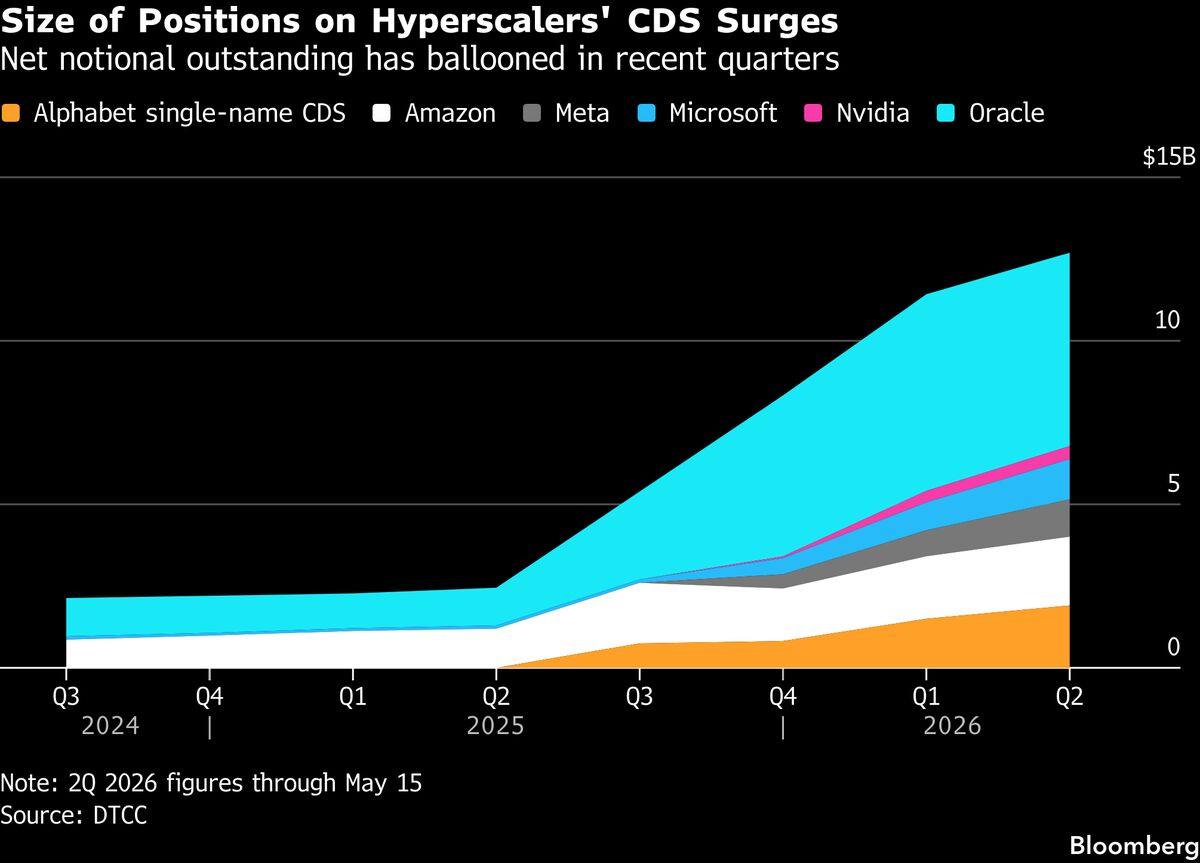
Hyperscaler CDS net notional outstanding has ballooned. From around $2 billion in mid-2024 to over $13 billion by Q2 2026 across Alphabet, Amazon, Meta, Microsoft, Nvidia and Oracle single-name CDS. Oracle is the largest slice, but Alphabet, Amazon and Microsoft each carry tens of billions in protection now. The position size is the signal. The credit market is no longer treating Big Tech as a homogeneous AAA-adjacent block. Naming risk by company is the first sign that the AI capex thesis has a credit-quality question attached. Source: Bloomberg Credit Weekly.
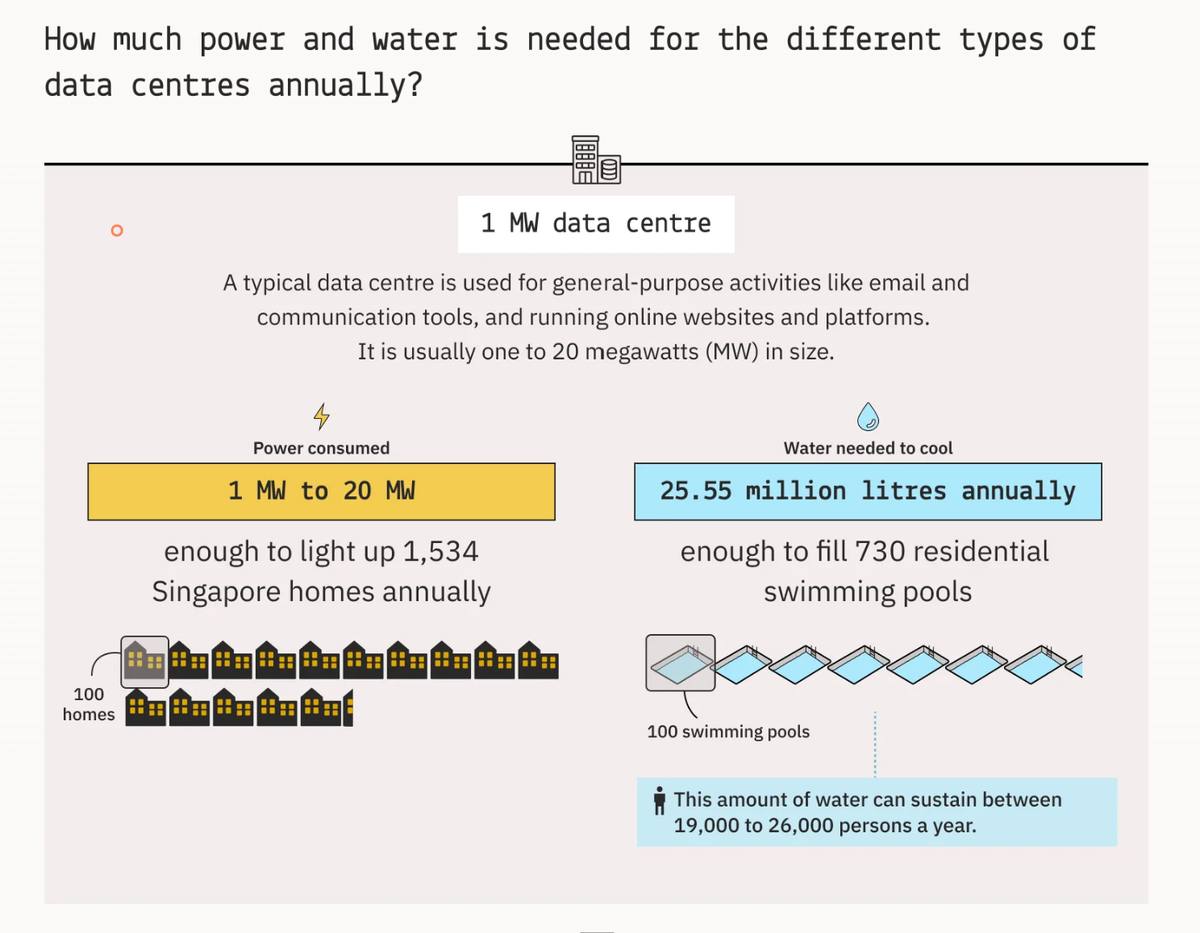
The utility bill of an AI data centre, in Singapore-home units. A typical 1MW general-purpose data centre consumes 1 to 20 megawatts of power — enough to light up 1,534 Singapore homes annually — and 25.55 million litres of water for cooling, enough to fill 730 residential swimming pools every year. Multiply by the hyperscaler builds across Singapore, Johor and Batam, and the strain on grid, water and power planning lands at a national-utility scale. The credit channel finances the cement, the steel and the GPUs. The utility channel pays the running cost. See Nicole Lim's piece with Kontinentalist. Source: Nicole Lim & Kontinentalist.
Friday Fade
Tokyo CPI is the BOJ June read, the eurozone CPI cluster lands the ECB June read, Canada Q1 GDP rounds the macro calendar. The Shangri-La Dialogue opens in Singapore with Hegseth attending through May 31. Bessent at the Reagan Forum in California. Sovereign rating reviews for France, Hungary and South Africa. Heading into Memorial Day weekend, the bar tightens for any new exposure. Costco after the close.
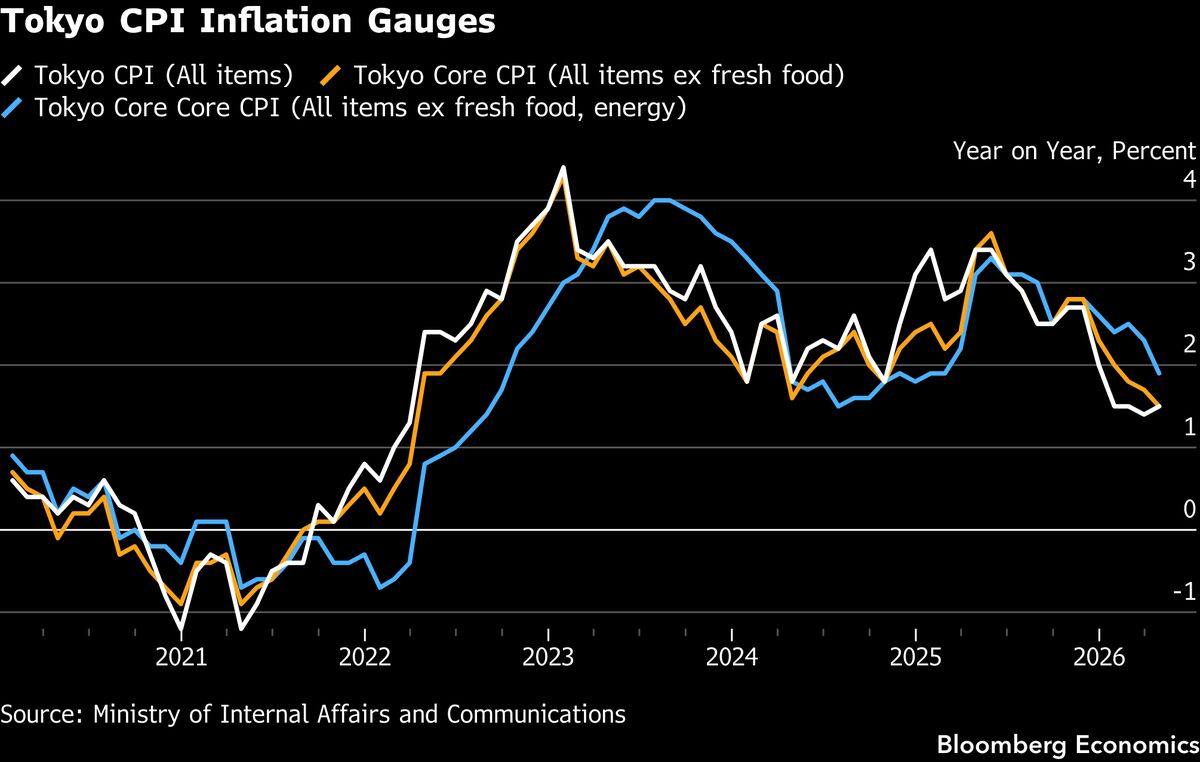
Tokyo May CPI is expected to hold at 1.5% year-on-year ex fresh food, the print BOJ Ueda will read in his first speech at the IMES Conference in Tokyo this week. Smaller food-price gains likely offset upward pressure from oil and wage growth. The core gauge ex fresh food and energy is expected at 1.8% from 1.9%. A steady reading would put the BOJ in a difficult position as it leans toward another rate hike; a hot print pulls the June 25-basis-point hike to 1.0% forward. The yen carry is the most exposed leg in the global book to that pull. Source: Bloomberg.
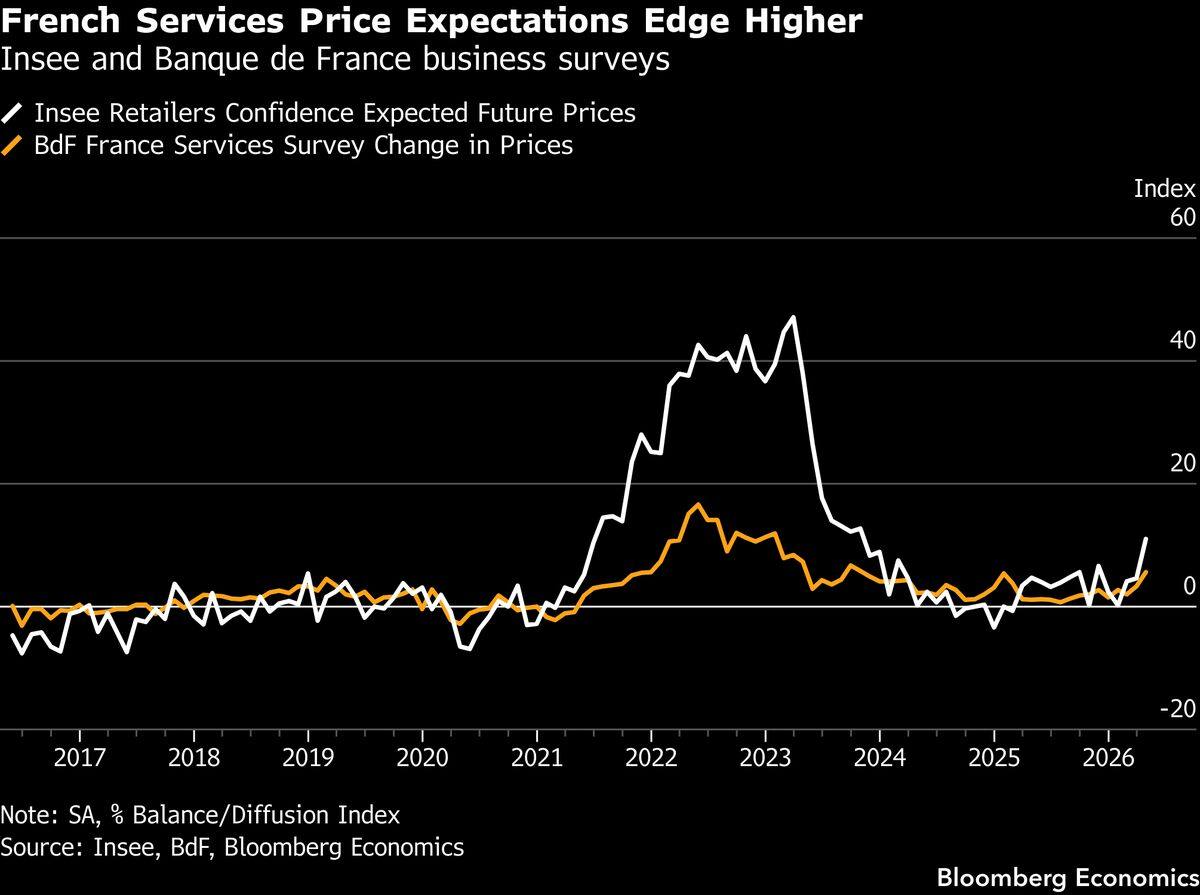
France HICP May expected to rise to 2.9% from 2.5% in April, the fuel-price pass-through showing up despite tax measures designed to cushion it. Underlying pressure stays moderate as the economy grows below potential, but transport costs lead the contribution. Beyond energy, spillovers stay limited — services-price expectations are edging higher with contained second-round impact. Core is expected at 1.5% from 1.4%. The print is one of four landing on the same Friday and will set the tone for the ECB's June meeting. Source: Bloomberg.
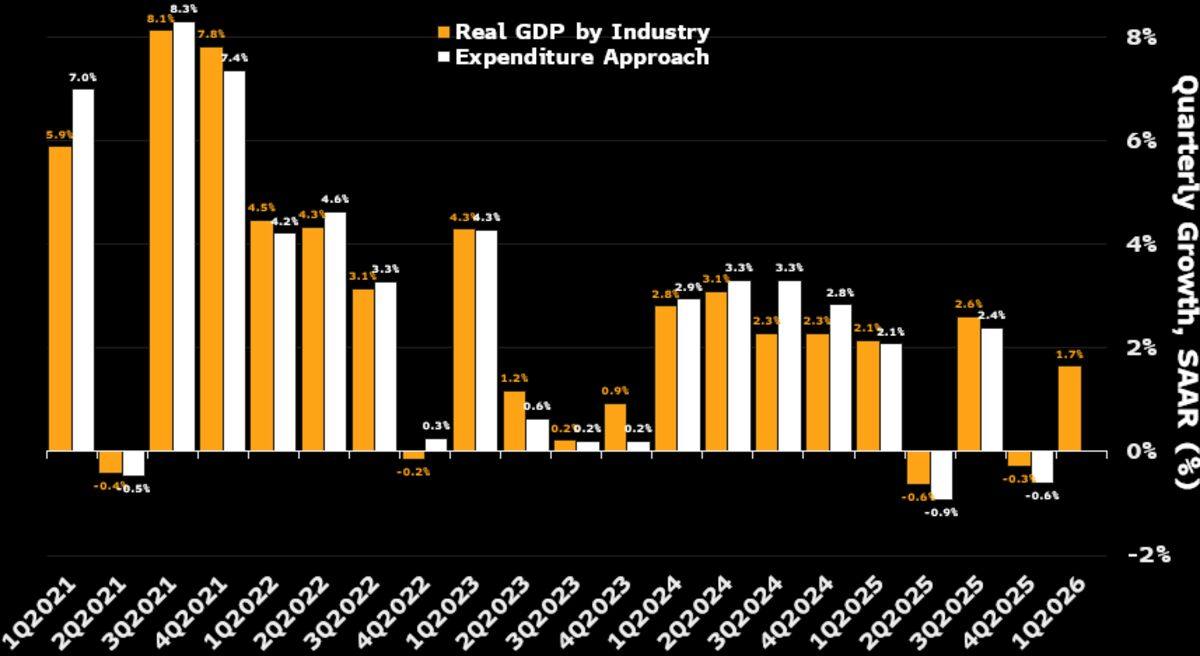
Canada Q1 GDP likely grew at an annualised pace of 1.3% after contracting 0.6% at the end of 2025. Strong retail and government spending support the headline, while net exports likely drag. Industry-level data flag upside, implying GDP expanded at a 1.7% annualised pace — but industry measures usually overstate the strength of growth. The pace stands in contrast to weak labour-market data, which likely keeps the Governing Council on hold. Canada's print is the Friday EM-adjacent read that closes the macro week. Source: Bloomberg.
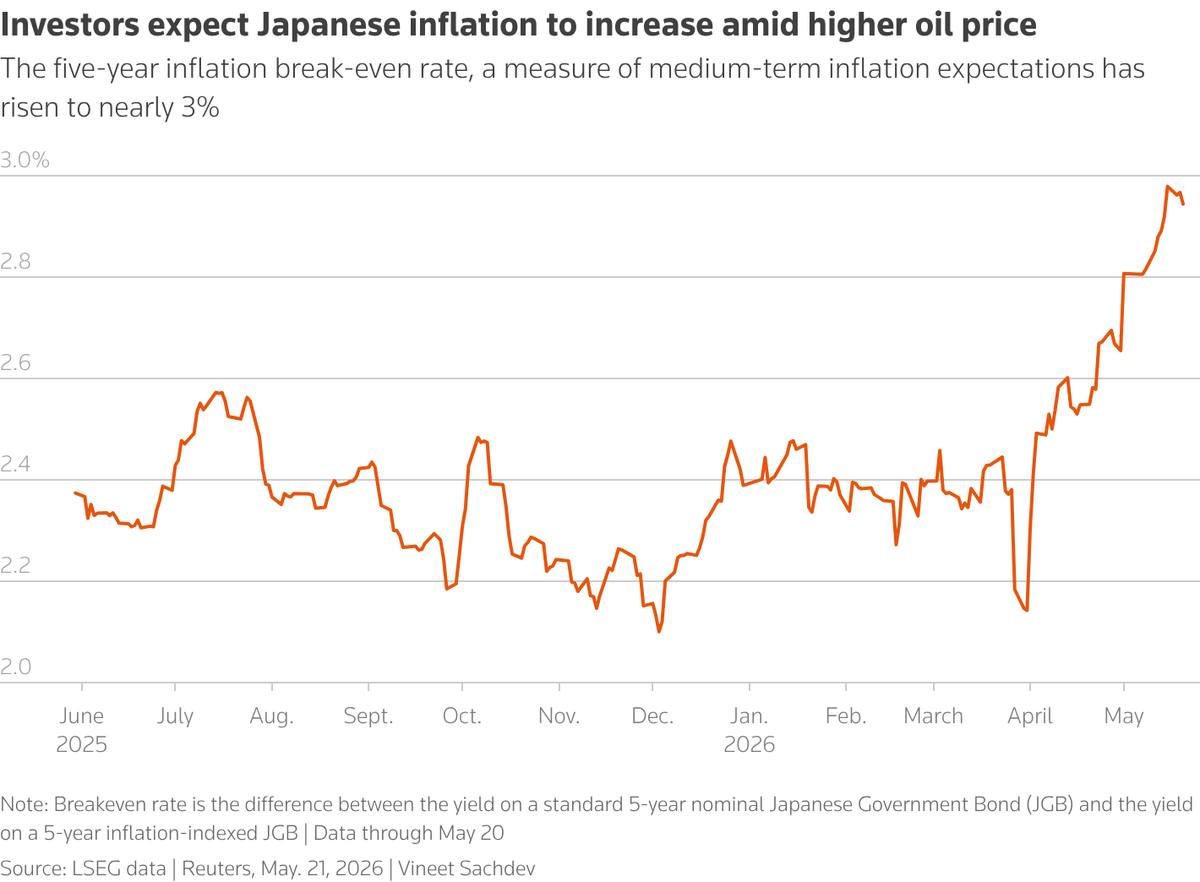
The five-year inflation break-even nears 3%. The BOJ has been looking for the evidence to normalise policy, and Friday's Tokyo CPI may provide it. Markets have grown increasingly certain that the BOJ hikes next month for the first time since December after last month's hawkish hold. Inflation is expected to keep climbing as oil stays elevated and the weak yen lifts import costs. The chart is the bond-market view that the BOJ is now behind the curve. Source: Reuters.
VC+ Special Dispatch — The State of Global Energy: Part 1
Part one of a two-part dispatch on the global energy system, arriving as the Hormuz crisis disrupts roughly 20% of global oil trade and Brent sits above $120. Part one maps the macro picture: how energy consumption has evolved across two centuries, who burns the most today, and which economies win or lose from the $2.9 trillion fossil-fuel trade. Seven charts. Part two will go deeper into oil and gas trade flows and the price cycles rippling through the world economy.
Two Centuries of Energy in a Single Chart
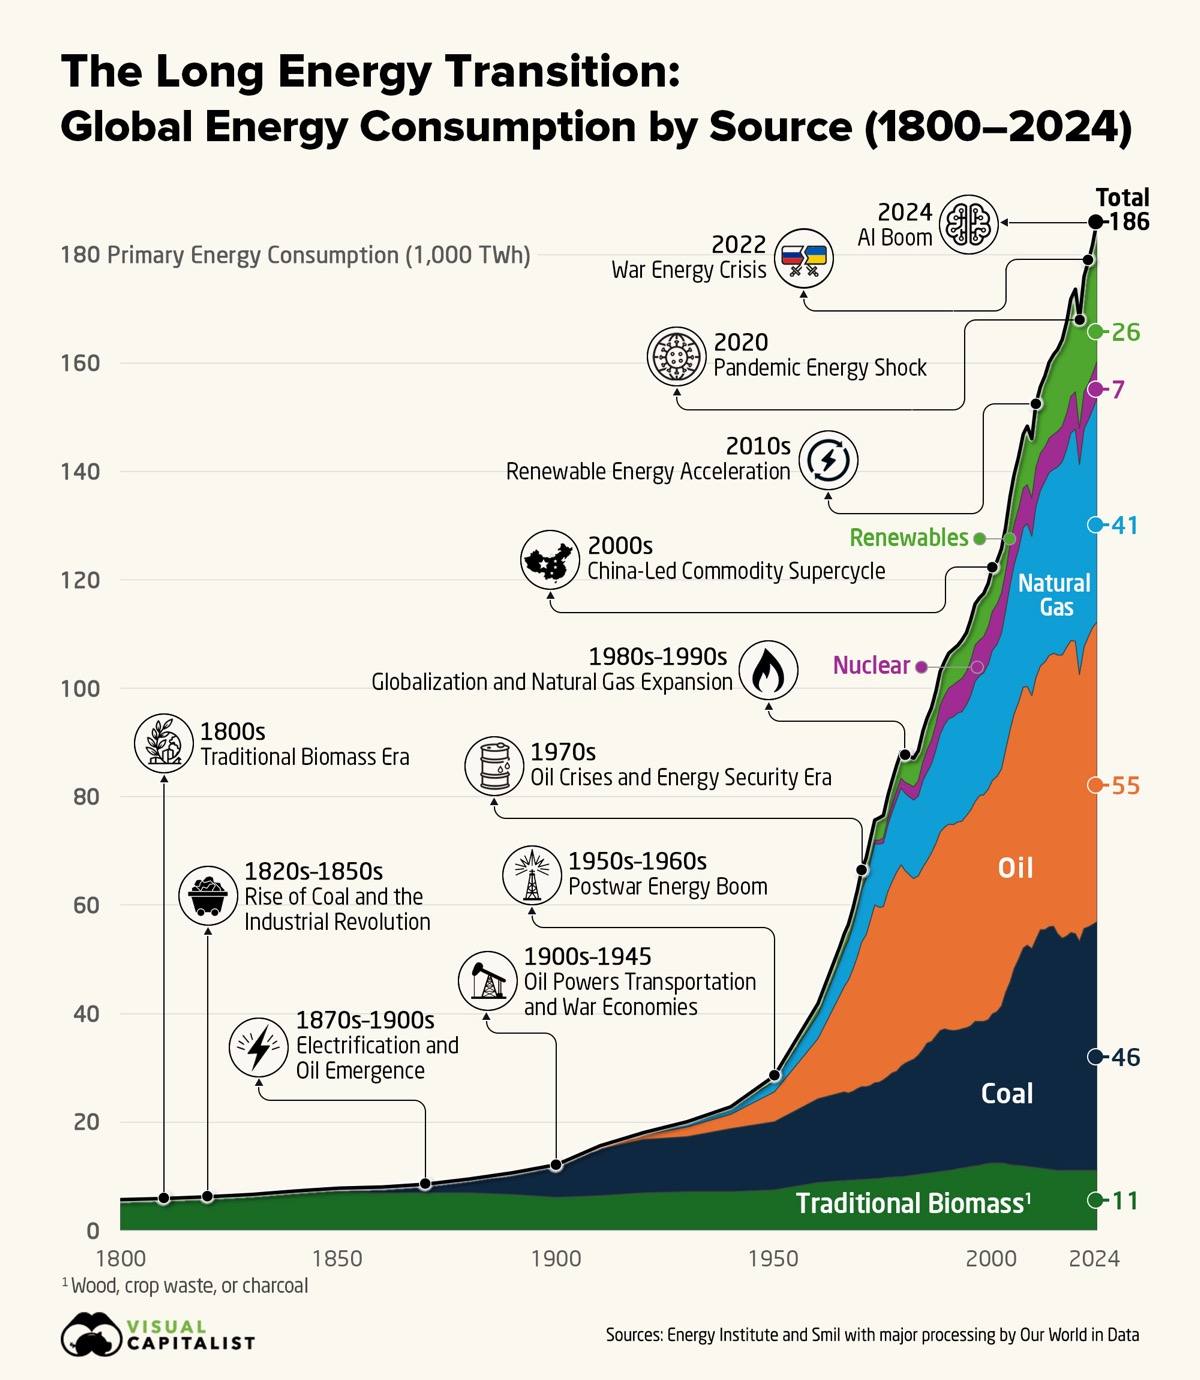
Two centuries of energy in a single chart. Global energy consumption has expanded more than thirtyfold since 1800, from roughly 5,650 TWh to 186,000 TWh in 2024. Industrialisation, electrification and rising living standards have all pulled energy use higher, well beyond what population growth alone would predict. Each major transition — wood to coal, coal to oil, oil to gas — unfolded over decades rather than years. The 21st century is now layering renewables on top of that stack, though fossil fuels still supply the majority. The latest inflection is unfolding right now. Source: Visual Capitalist.
Where the World Burns Energy Today
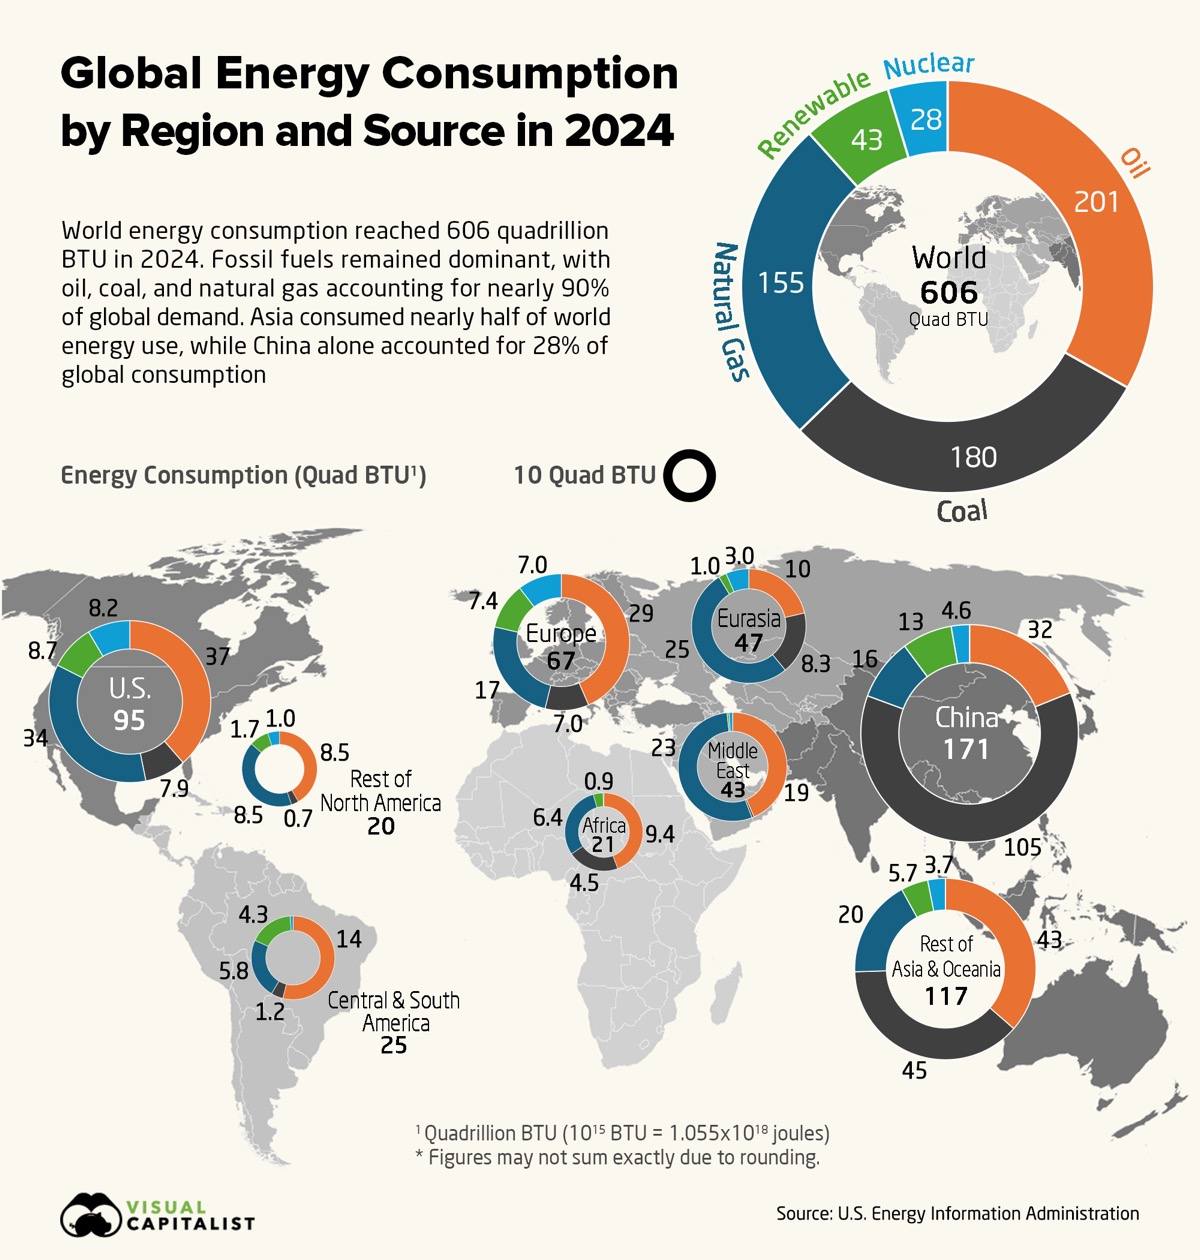
Where the world burns energy today. Global energy consumption reached 606 quadrillion BTU in 2024, according to the EIA. Oil leads at 33%, followed by coal at 30% and natural gas at 26%. Renewables and nuclear together still account for under 12%, and fossil fuels supply close to 90% of global energy demand. Asia and Oceania consume nearly half of world energy. China alone burns 171 quadrillion BTU, roughly 28% of the global total and nearly twice the US level. Source: Visual Capitalist.
The China Effect
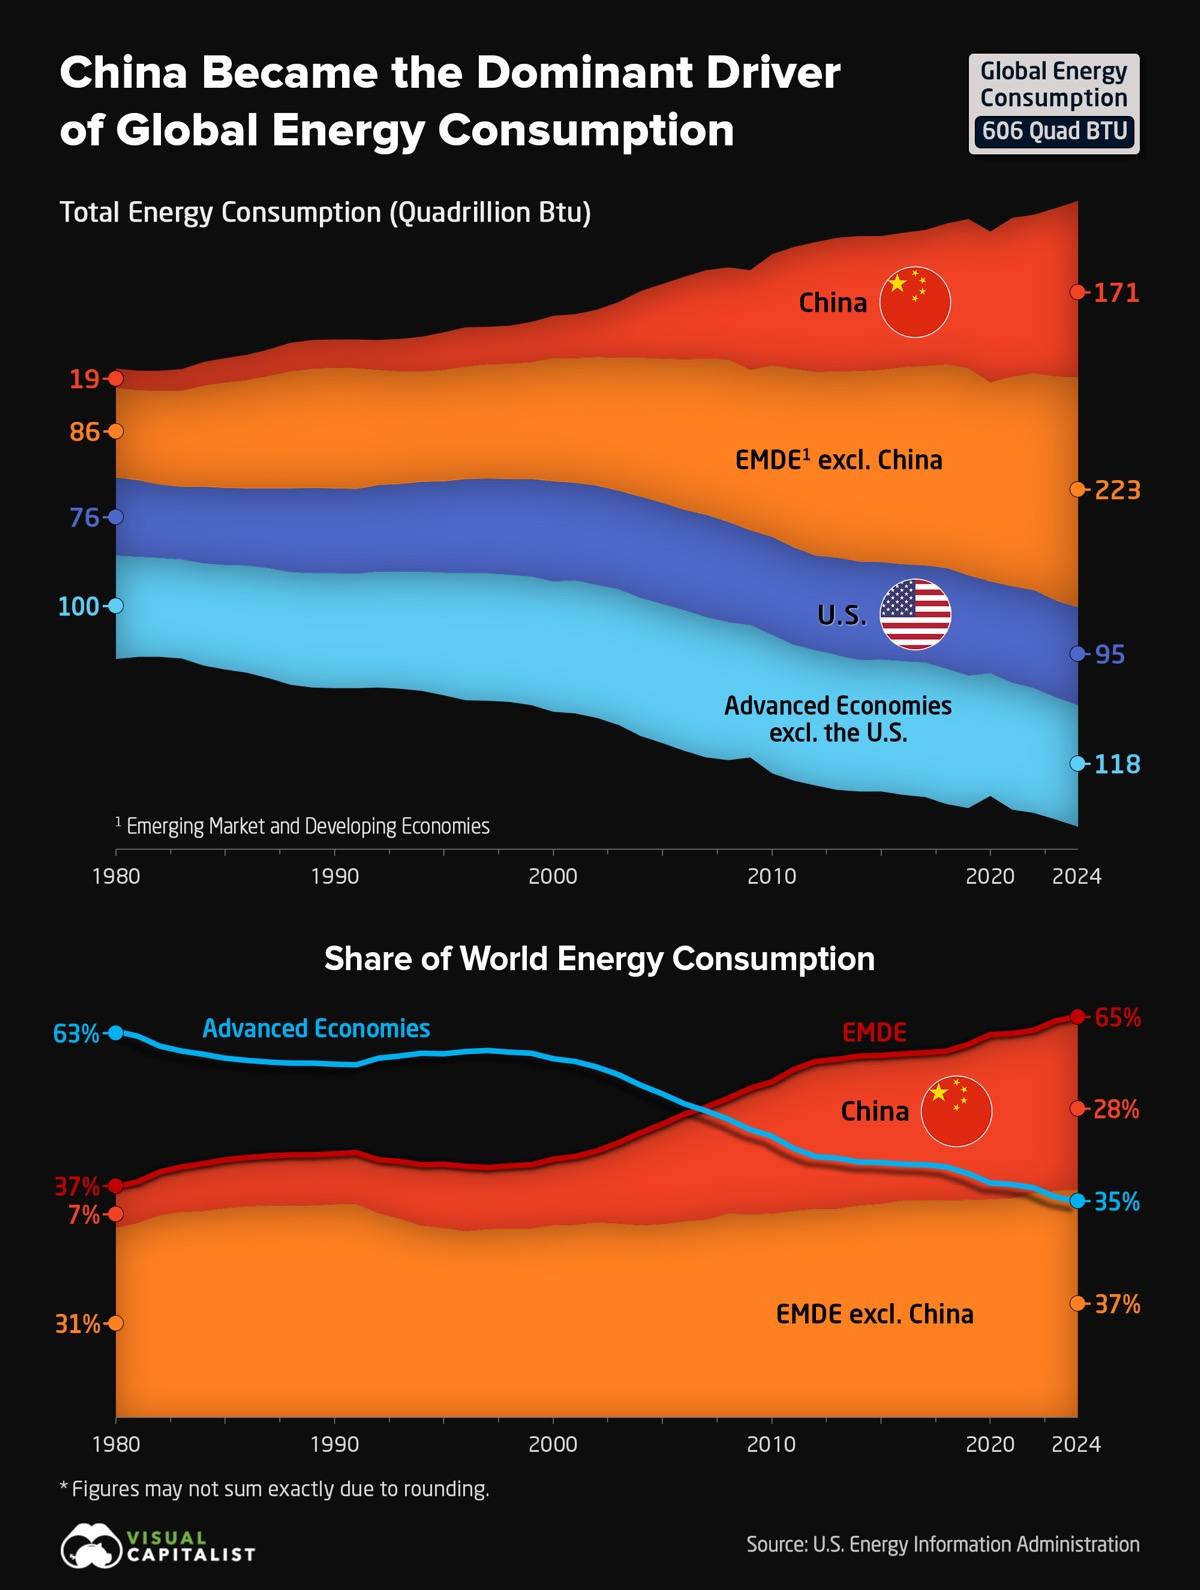
The China Effect. From 1980 to 2024, China's energy consumption surged 812%, a 5.2% annual growth rate. Advanced economies expanded just 21% over the same span. China alone drove 58% of global energy consumption growth since 2000, while advanced economies' share of world demand fell from 63% in 1980 to 35% today. Manufacturing offshoring, efficiency gains and the shift to services explain part of the gap. The deeper story is China's industrial transformation — a century of Western energy buildout compressed into four decades. Source: Visual Capitalist.
The Energy Surplus Map
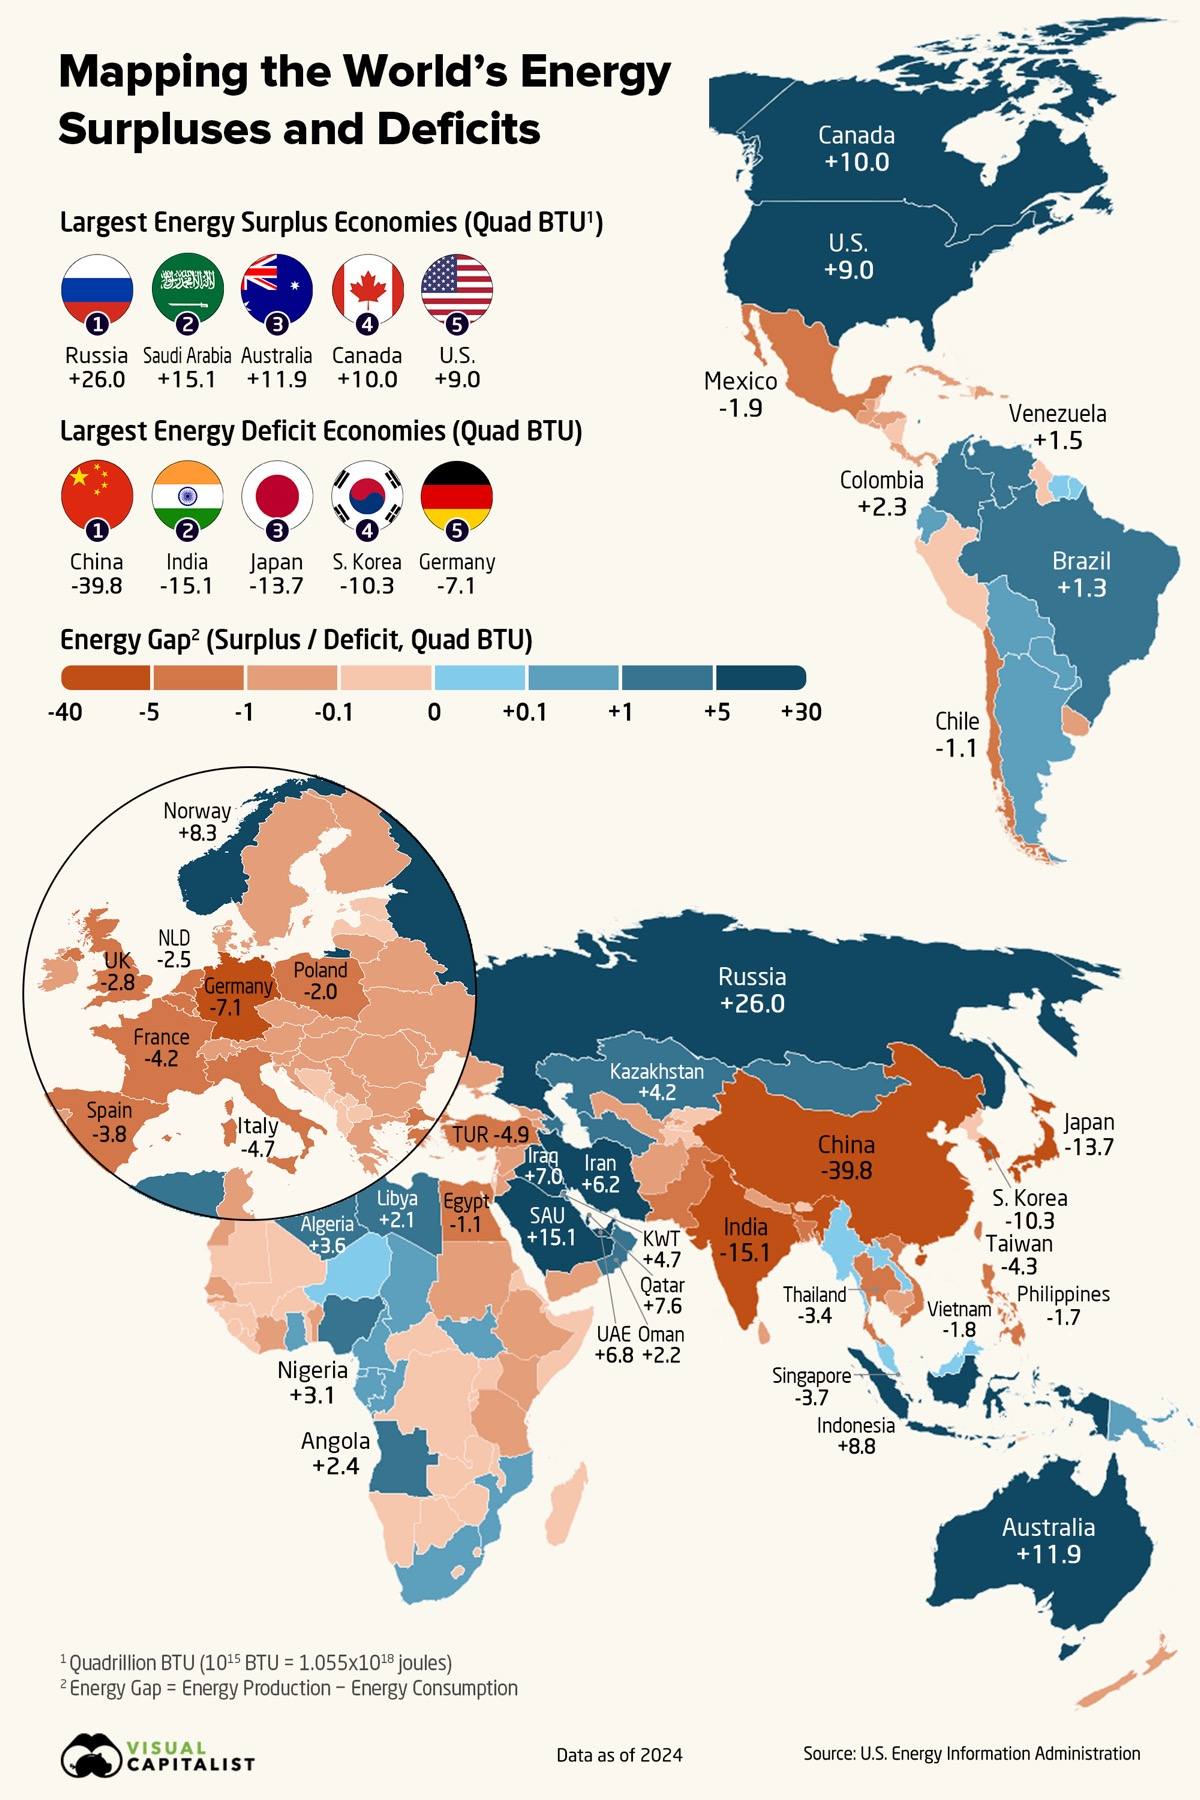
The energy surplus map. Forty economies produce more energy than they consume; another 76 run energy deficits and depend on imports. Russia leads the surplus side at +26.0 quadrillion BTU, followed by Saudi Arabia (+15.1), Australia (+11.9), Canada (+10.0) and the US (+9.0). On the deficit side, China stands alone at -39.8, followed by India (-15.1), Japan (-13.7), South Korea (-10.3) and Germany (-7.1). Those five deficit economies anchor most of the world's industrial output, and their exposure to maritime chokepoints grows every time one closes. Source: Visual Capitalist.
Who Sells Energy, and Who Buys It
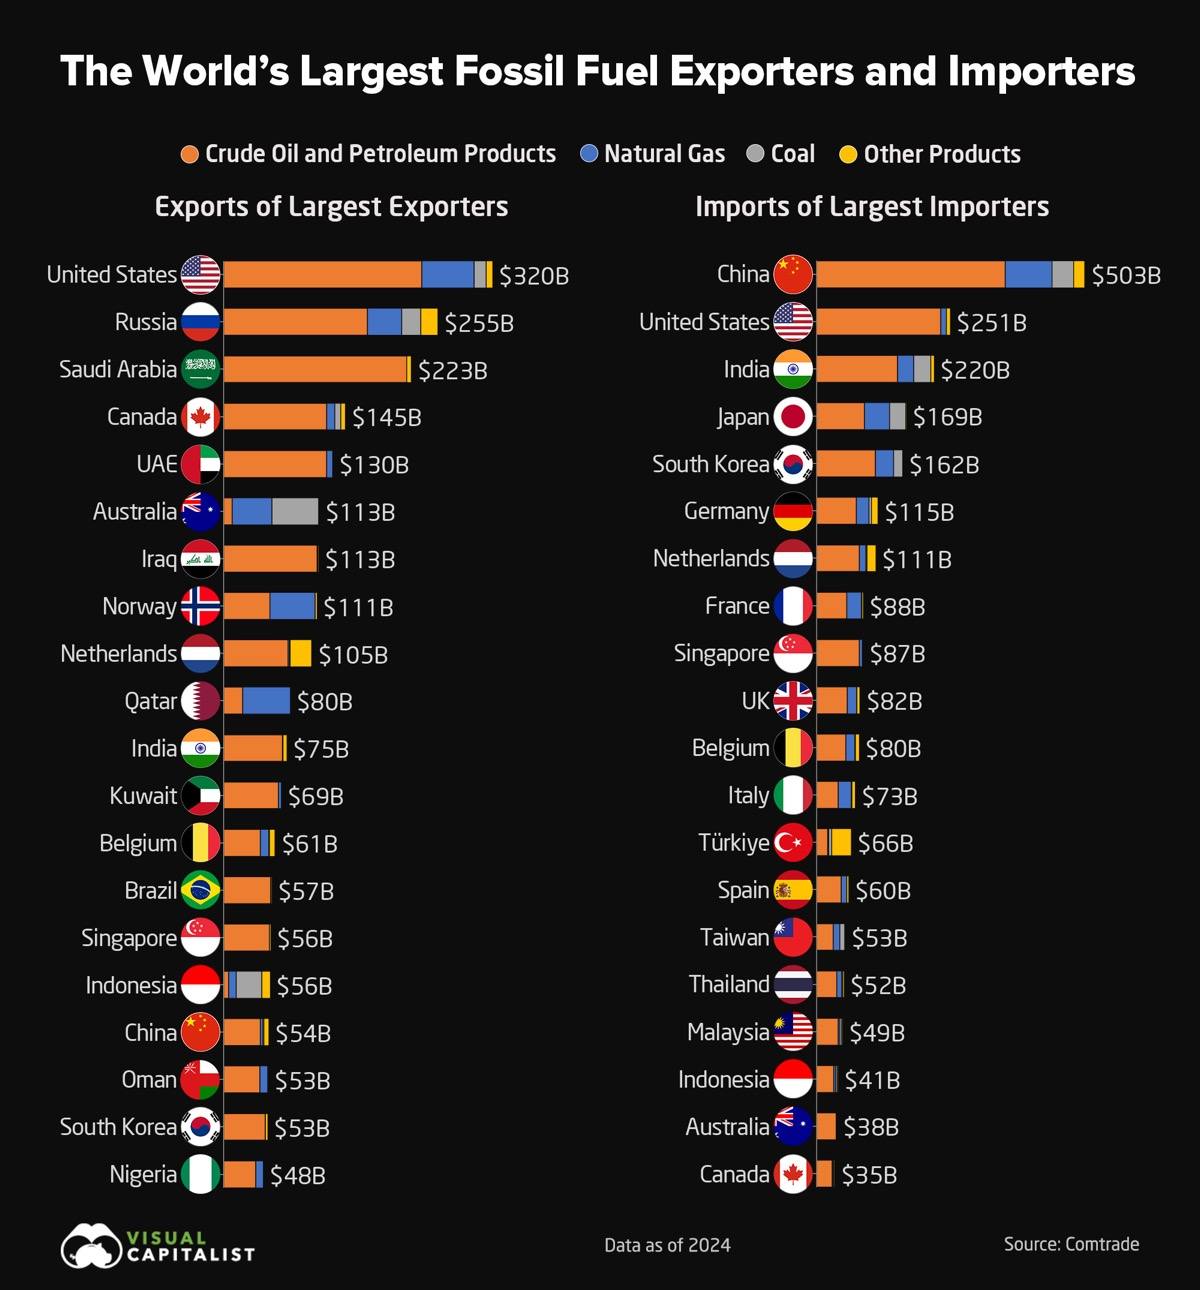
Who sells energy, and who buys it. Global fossil-fuel trade totalled $2.9 trillion in 2024, oil and petroleum products accounting for two-thirds of the value. The US is the world's largest fossil-fuel exporter at $320 billion, followed by Russia ($255B), Saudi Arabia ($223B), Canada ($145B) and the UAE ($130B). On the import side, China leads at $503 billion, roughly twice the US level, followed by India, Japan, South Korea and Germany. The US is unusual — largest exporter and second-largest importer at once, reflecting refinery scale and the appetite for crude grades shale does not supply. Source: Visual Capitalist.
The Economies Built on Fossil-Fuel Exports
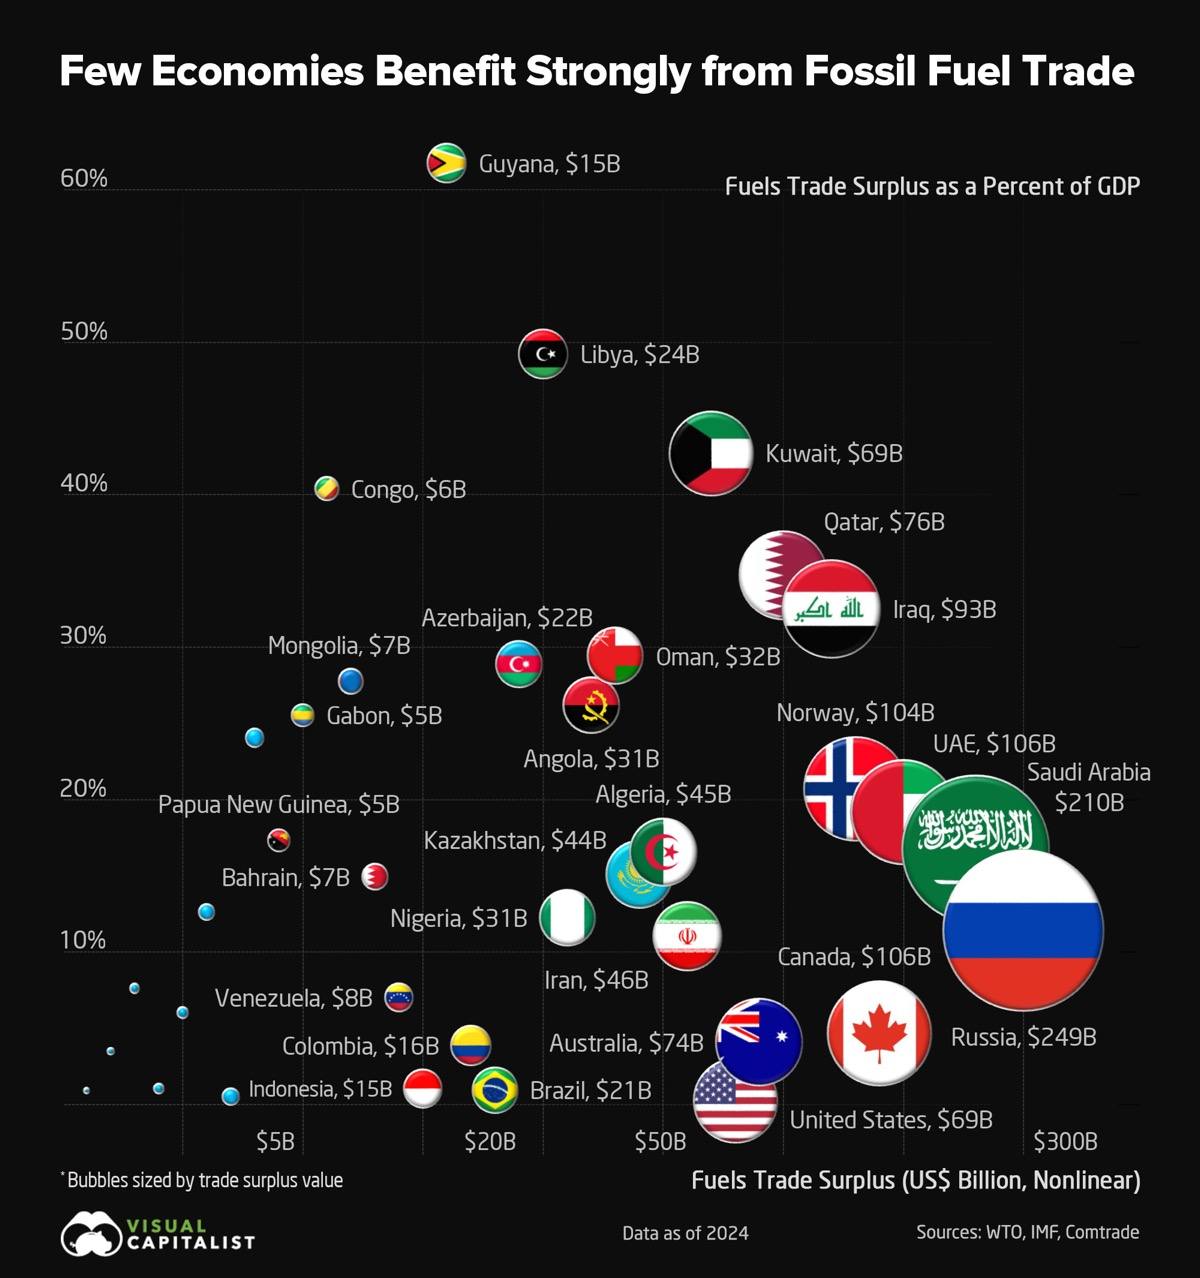
The economies built on fossil-fuel exports. Only 51 economies, about a quarter of countries worldwide, run fossil-fuel trade surpluses. Just 26 earn more than 5% of GDP from those exports, the threshold where energy becomes a defining feature of the national economy. Guyana now tops the world at 63%, ahead of Libya (49%), Kuwait (43%), Republic of Congo (40%) and Qatar (35%). ExxonMobil's Stabroek block is on track to push Guyana past 1 million barrels per day before end-2026, and the economy is projected to expand another 16% in real terms this year. Source: Visual Capitalist.
The Economies Most Exposed to Energy Imports
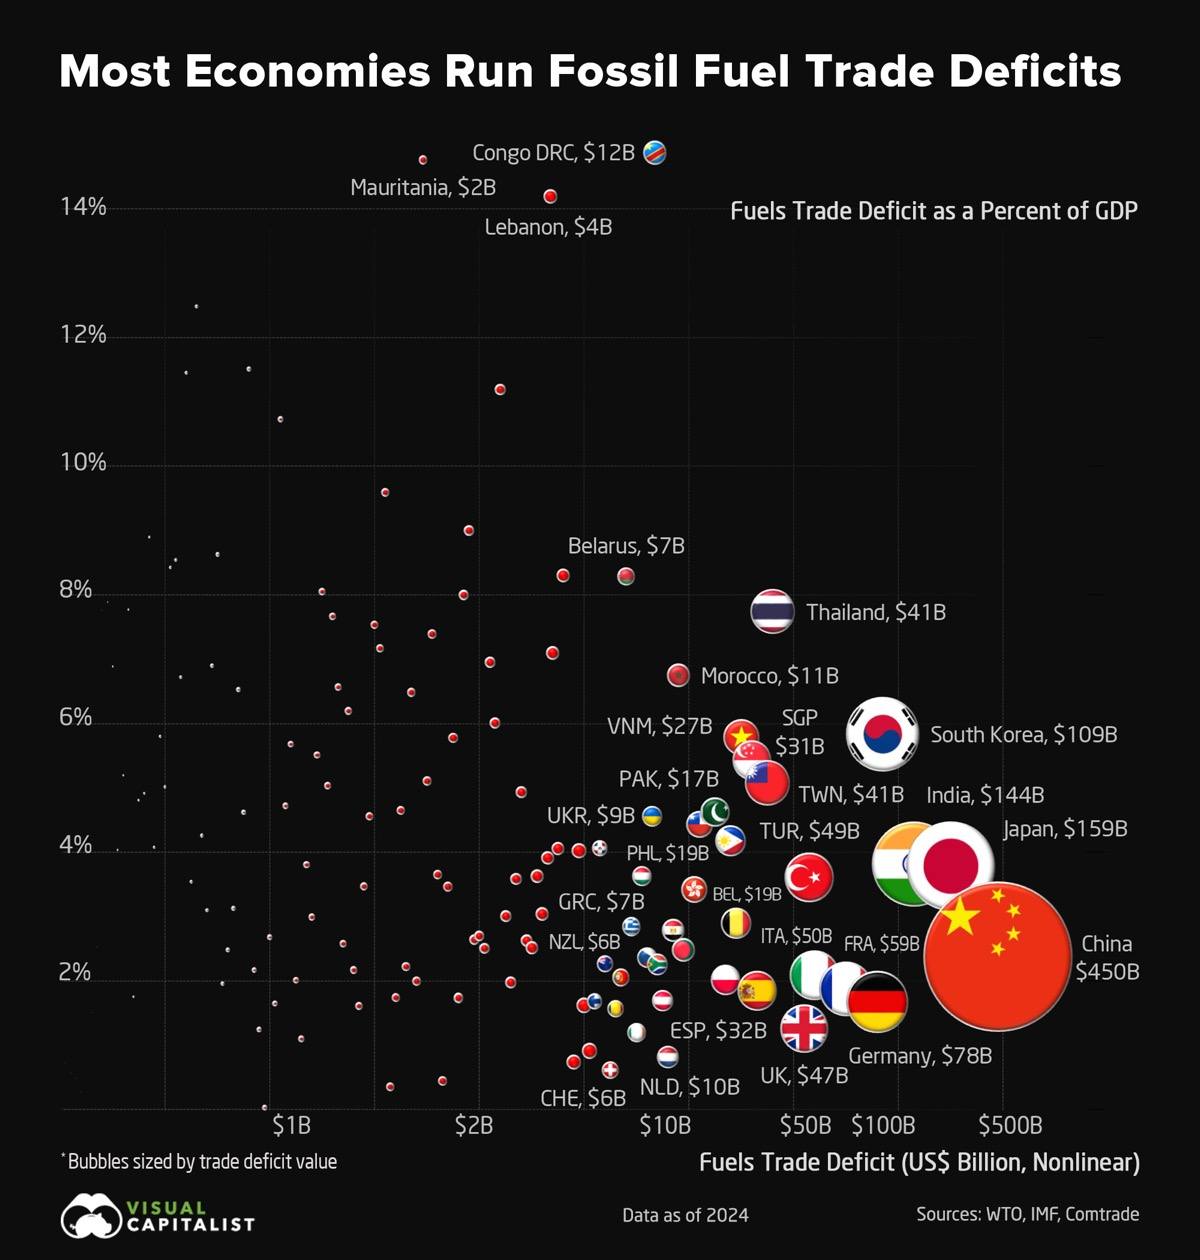
The economies most exposed to energy imports. On the other side of the ledger, 140 economies — 73% of countries — run fossil-fuel trade deficits, covering three-quarters of the global population. China runs the largest absolute deficit at $450 billion, followed by Japan ($159B), India ($144B), South Korea ($109B) and Germany ($78B). The sharper exposure sits in the lower-income economies — DR Congo and Mauritania each spend roughly 15% of GDP on imported fossil fuels, with Lebanon, Gambia and Liberia close behind. Every energy shock lands on those countries first. Source: Visual Capitalist.
The Good Wrap
What is left at the close. The Reuters seating diagrams of last week’s Trump-Xi banquet, the deepest read on diplomatic protocol since the 2017 visit. The global banking-power ranking with JPM at the top. The factor-strategy comparison that says the choice of rule matters more than being invested. The art-market test, the World Cup ticket spike, Singapore shrinkflation, the divorce-by-occupation chart that puts actuaries last. The warming stripes paired with the AMOC piece, the slow news becoming the fast news. Closing on Pu’erh tea, the same leaf taking two completely different journeys depending on the process the world chooses to run it through.
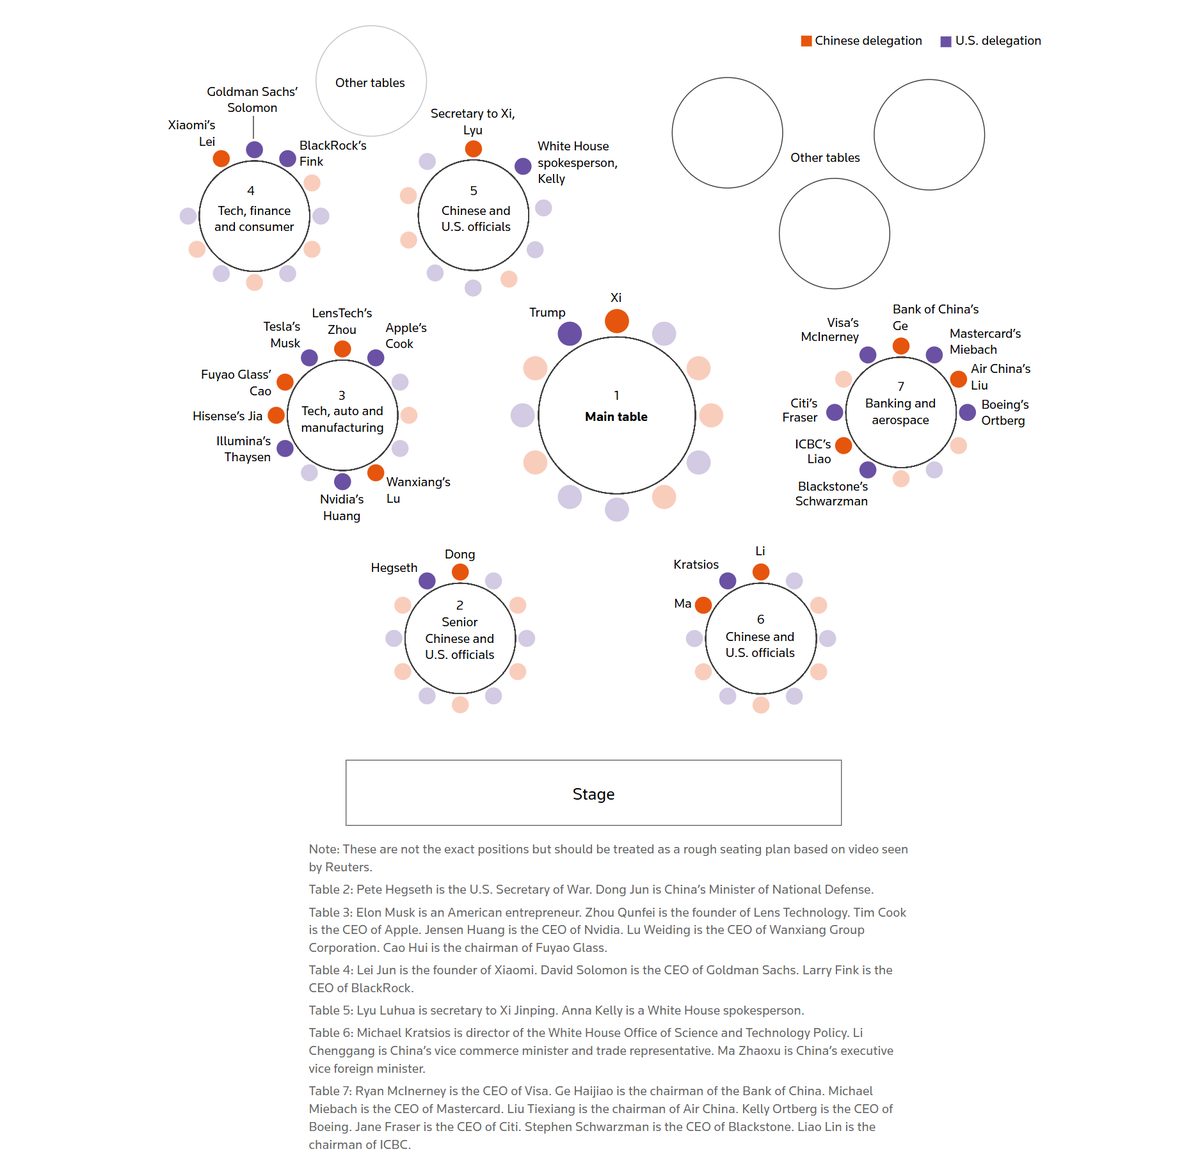
Who sat where at the Trump-Xi banquet, the wide shot. Seven tables, ranked by distance from the main table and by right-hand precedence in Chinese protocol. The tech, auto and manufacturing table sat Musk, Cook, Huang and Lu Weiding next to Zhou Qunfei. The tech, finance and consumer table put Lei Jun beside Solomon and Fink. Banking and aerospace ran from Visa-McInerney through Citi-Fraser to Schwarzman, the China side led by ICBC's Liao and Bank of China's Ge. The geography of the room was the negotiation. Visit the full Reuters interactive for the menu, the 2017-versus-2026 contrast and the wives. Source: Reuters Graphics.
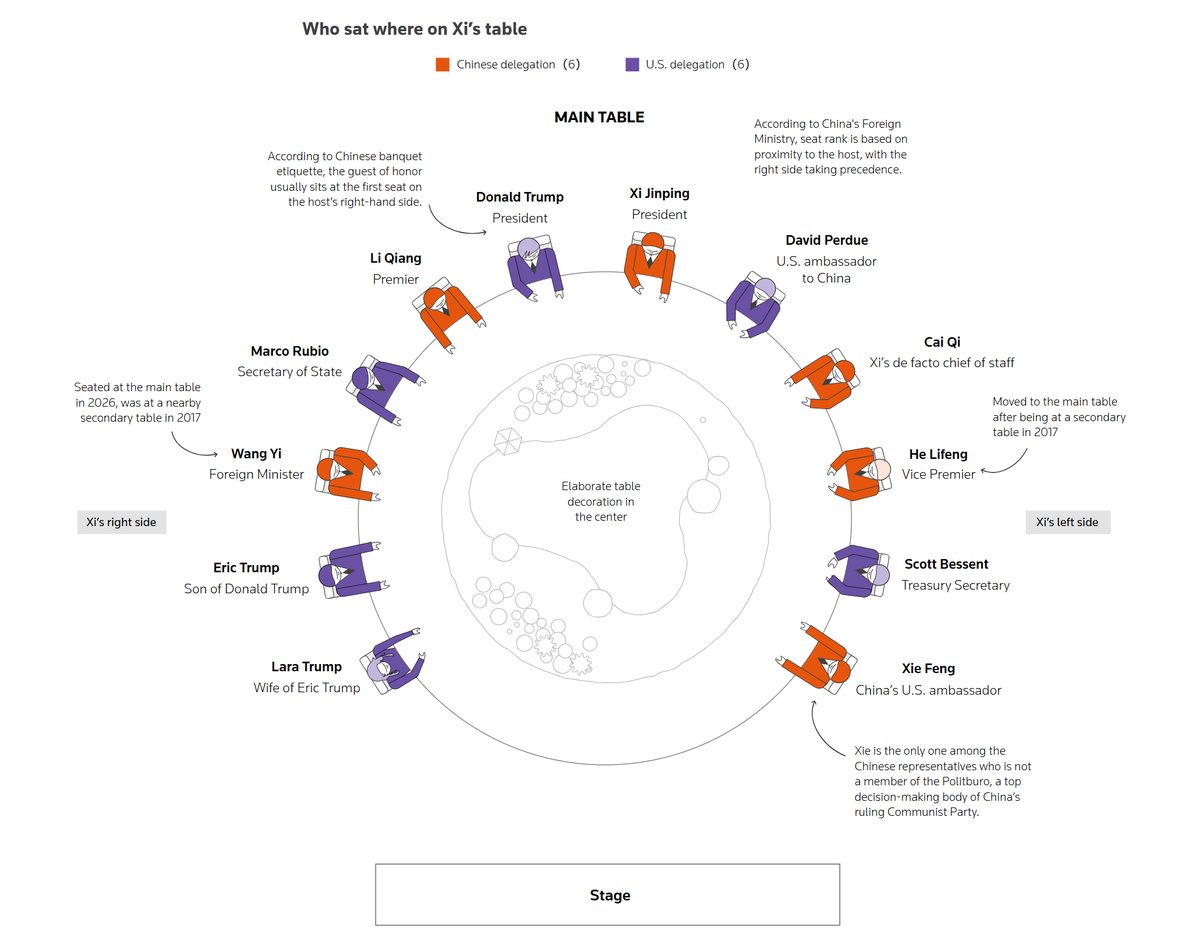
Who sat where on Xi's table, the zoom. Twelve seats, half US and half Chinese. Trump in the first seat on Xi's right by Chinese protocol that ranks proximity to the host as status. Wang Yi moved up from a 2017 secondary table to the main one, and He Lifeng joined him — signalling who runs the China side now. Xie Feng, China's US ambassador, is the only one on Xi's side not in the Politburo. Stephen Miller was the only person in Trump's circle to sit at both 2017 and 2026 main tables. The seat is the message. Source: Reuters Graphics.
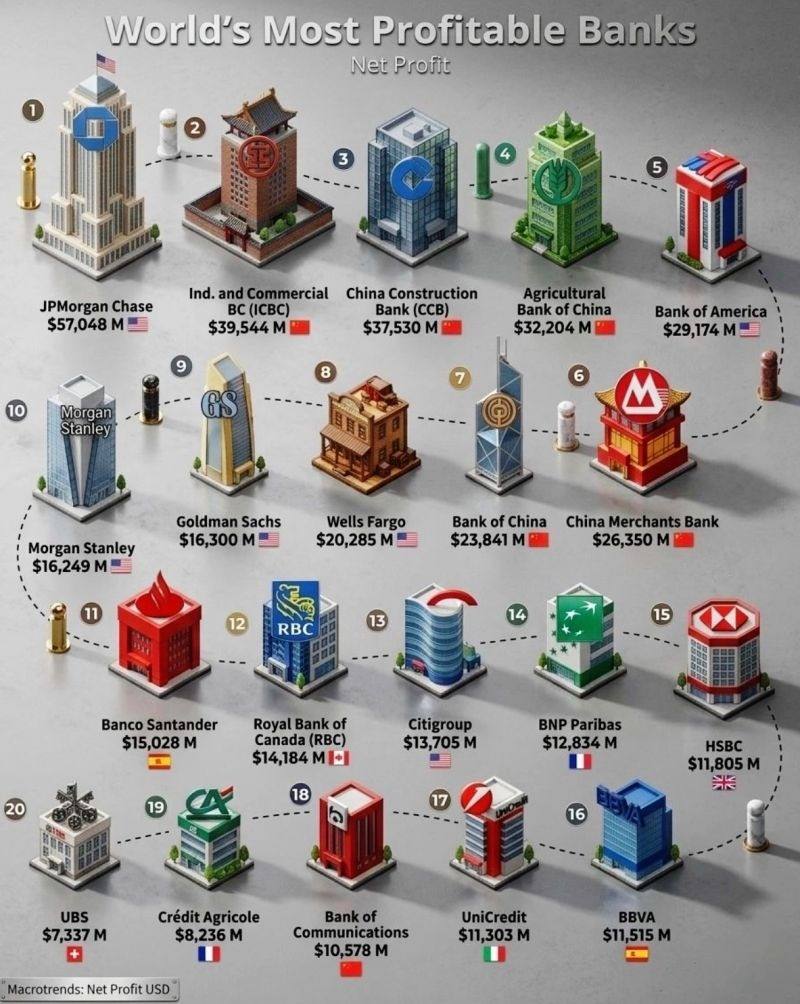
Global banking power concentrates around scale, data and balance sheet. The ranking of the world's most profitable banks shows the sector is increasingly dominated by institutions with massive balance sheets, diversified revenue and deep client ecosystems. JPMorgan stands at the top with around $57 billion in net profit, confirming the strength of the universal-banking model — investment banking, corporate banking, consumer finance, payments, wealth management and trading at global scale. Behind it sit ICBC, China Construction Bank, Agricultural Bank of China and Bank of China, the profitability of banks deeply connected to domestic credit markets and state-supported ecosystems. Source: Bloomberg.
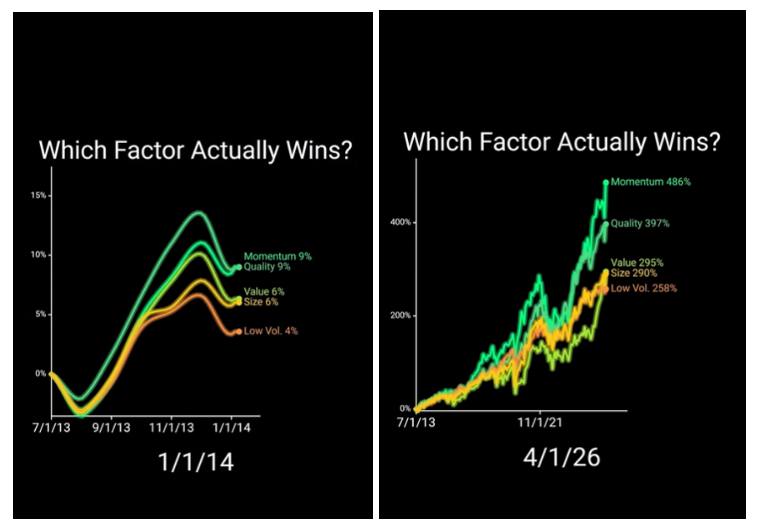
Not all factors perform the same. A comparison of five core institutional factor strategies over the same window, same starting point, different rules. Momentum buys what is going up — trends persist longer than expected, which is why this leads. Quality focuses on profitable, stable balance sheets, less extreme than momentum but consistent. Value lags for long stretches before working. Size tilts toward smaller companies, higher risk but not always rewarded. Low Volatility smooths the ride but gives up upside. The takeaway is not that factors fail — it is that the strategy you choose matters more than the fact of being invested. Source: Yunngeeski via Yahoo Finance.
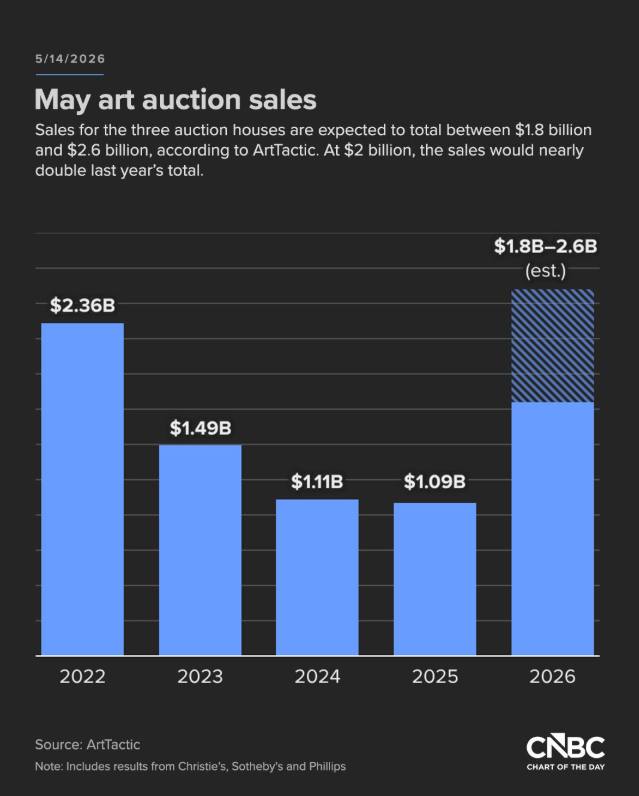
Nearly $2 billion of art comes up for auction in New York this week. The biggest test of the art market since the war began. Major houses are counting on blockbuster works from famed collections to carry the market past the geopolitical gloom and the volatile financial backdrop. Dealers say the rapid rebound that began last fall shows no sign of slowing, even as fears of a slowing global economy and a thinner Middle East buyer pool linger. The luxury bid is one of the cleanest cross-checks on whether the K-shaped economy still has its top end. Source: CNBC Chart of the Day.
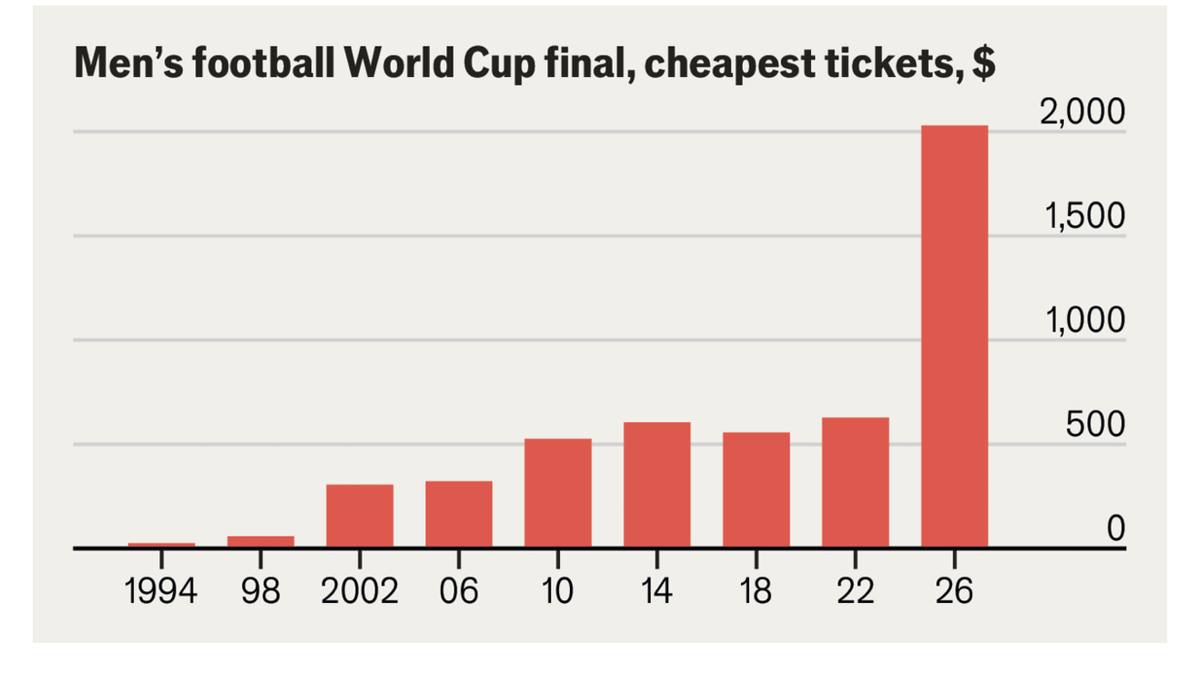
Even the cheapest seat at the World Cup final is now $2,000. FIFA's dynamic pricing for the 2026 Men's tournament, co-hosted by the US, Canada and Mexico, has roughly quadrupled the floor price in a single cycle — from around $500 at Qatar 2022 to $2,000 in 2026. Compare with under $50 in 1994 when the US last hosted. The trajectory is the airline-tariff model arriving at football's showcase. The cheap seat is the inflation print the fan feels in real time. Source: The Economist.
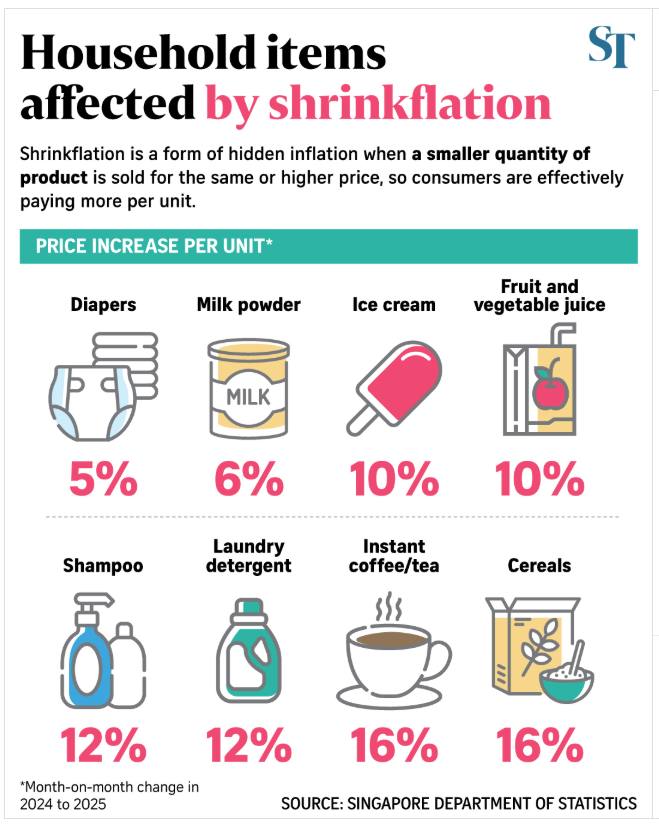
Singapore shrinkflation, the hidden price change. Shoppers are paying the same or more for less when it comes to instant coffee, tea, cereal and juice, according to the Department of Statistics. Less than 5% of items commonly purchased by resident households experienced shrinkflation through 2025, but the share is concentrated in the categories that feed daily routine. The chart maps the eight fast-moving consumer goods most affected by quietly reduced sizes across major supermarkets. The inflation print is what the Government reports; shrinkflation is what the household feels. Source: Singapore Department of Statistics.
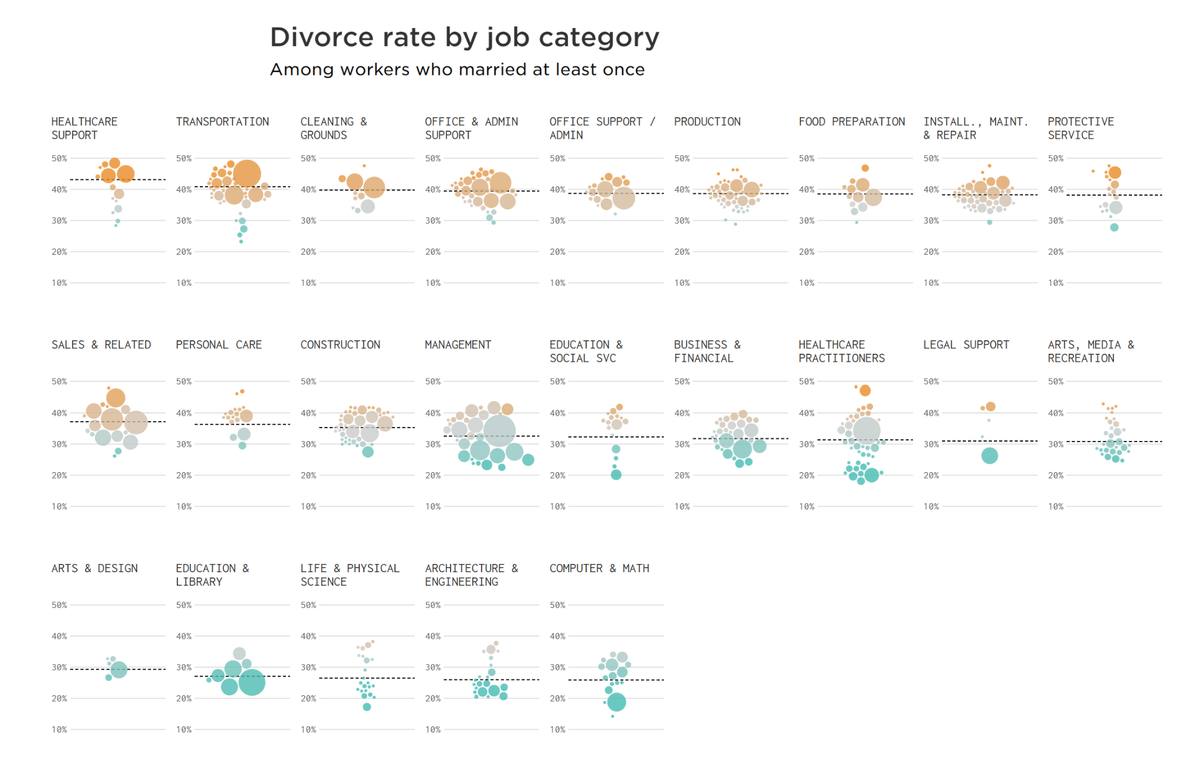
Divorce rates by occupation. Bus drivers, bartenders, vocational nurses and massage therapists show the highest rates, all near or above 48%. Actuaries — professional estimators of risk — are at the bottom at only 14%, with physical scientists nearly as low. The category breakdown puts healthcare support and transportation high, computer and math low, architecture and engineering low. The takeaway is the actuaries, right on the nose for a profession whose entire job is pricing tail risk. See the full FlowingData piece for the searchable map. Source: FlowingData.
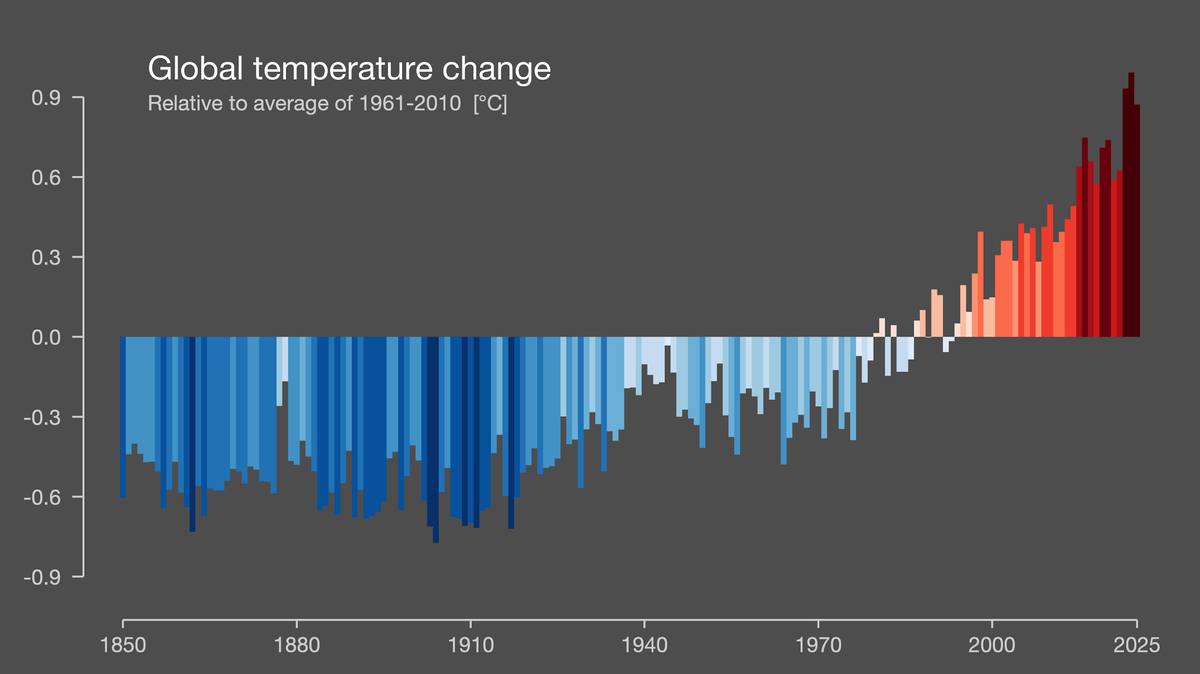
Warming stripes, decades on the same canvas. The University of Reading puts global temperature shift in one image, blue for years cooler than the 1961-2010 average, red for warmer, the page bleeding deeper red over the last decade. Next to it sits the harder fact. The Atlantic overturning circulation that moderates Europe and shelters the US East Coast has weakened by at least 15%, and observational work sees it half its current strength before 2100. East Coast sea levels are already rising two to four times faster than almost anywhere else, Hurricane Sandy's $8 billion bill an early invoice for 10 centimetres of rise. Western North America inherits a semi-permanent La Niña — drier years, intensified droughts, more wildfires — the California future the stripes have been pointing toward. The chart is the slow news. The dislocation is already here. Explore the interactive at Show Your Stripes. Source: University of Reading.
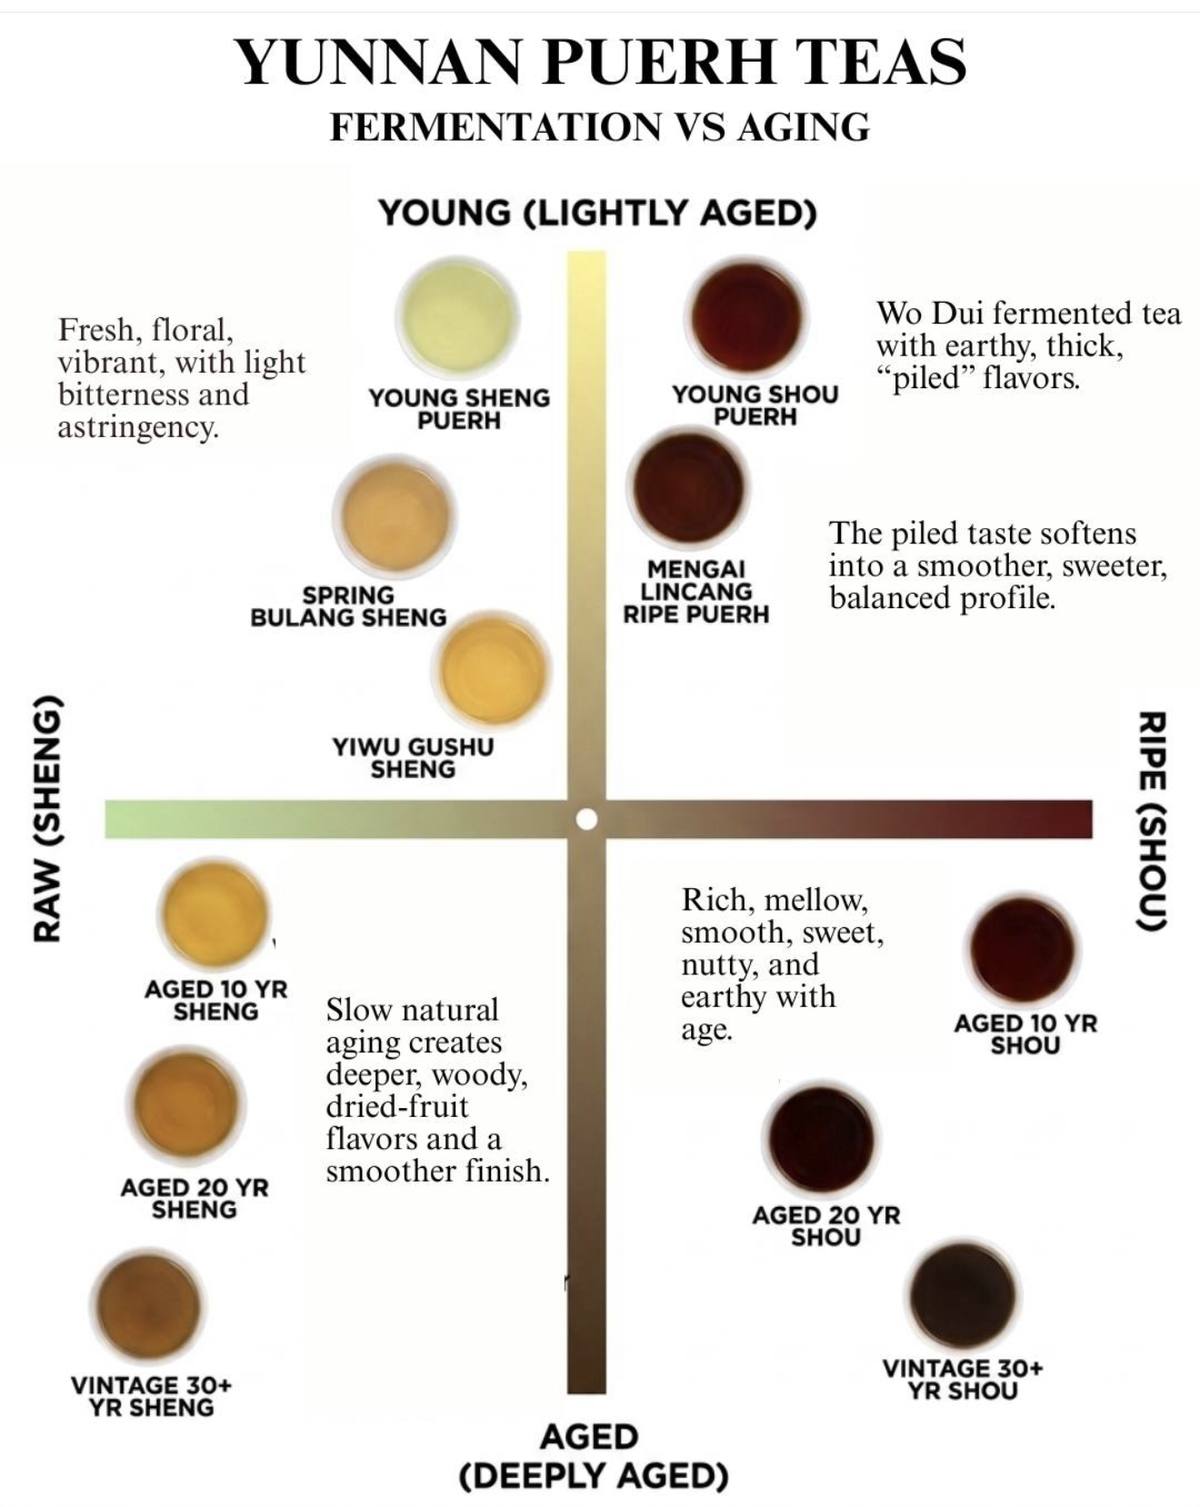
Pu'erh, the same leaf and two different journeys. Both raw (sheng) and ripe (shou) Pu'erh come from the same ancient tea trees in Yunnan. The difference is the process — fermentation versus natural aging. Young sheng is fresh, floral, vibrant, slightly bitter, transforming over decades into woody, dried-fruit sweetness. Shou is guided through the traditional Wo Dui fermentation process, developing rich earthy, "piled" flavours that mellow with age into smooth, sweet, nutty depth. The same cake can taste completely different at every stage. A fitting close for a week about divergence — the same input, the same starting point, two completely different journeys depending on the process the world chooses to run it through. See the source on Instagram. Source: Sommplicity.
Best,
Hoelon
WITPTW is a personal publication. Everything here is personal opinion and market commentary, written in a personal capacity. It is not investment advice and not a recommendation to buy or sell any security. It is not associated with, endorsed by, or representative of any employer, fund or company. Charts and images are reproduced from their original publishers, credited to their sources for commentary and discussion; all rights remain with the respective copyright holders.