Where the Pain Is
Personal views and market commentary. Not investment advice. Not associated with any employer or firm.
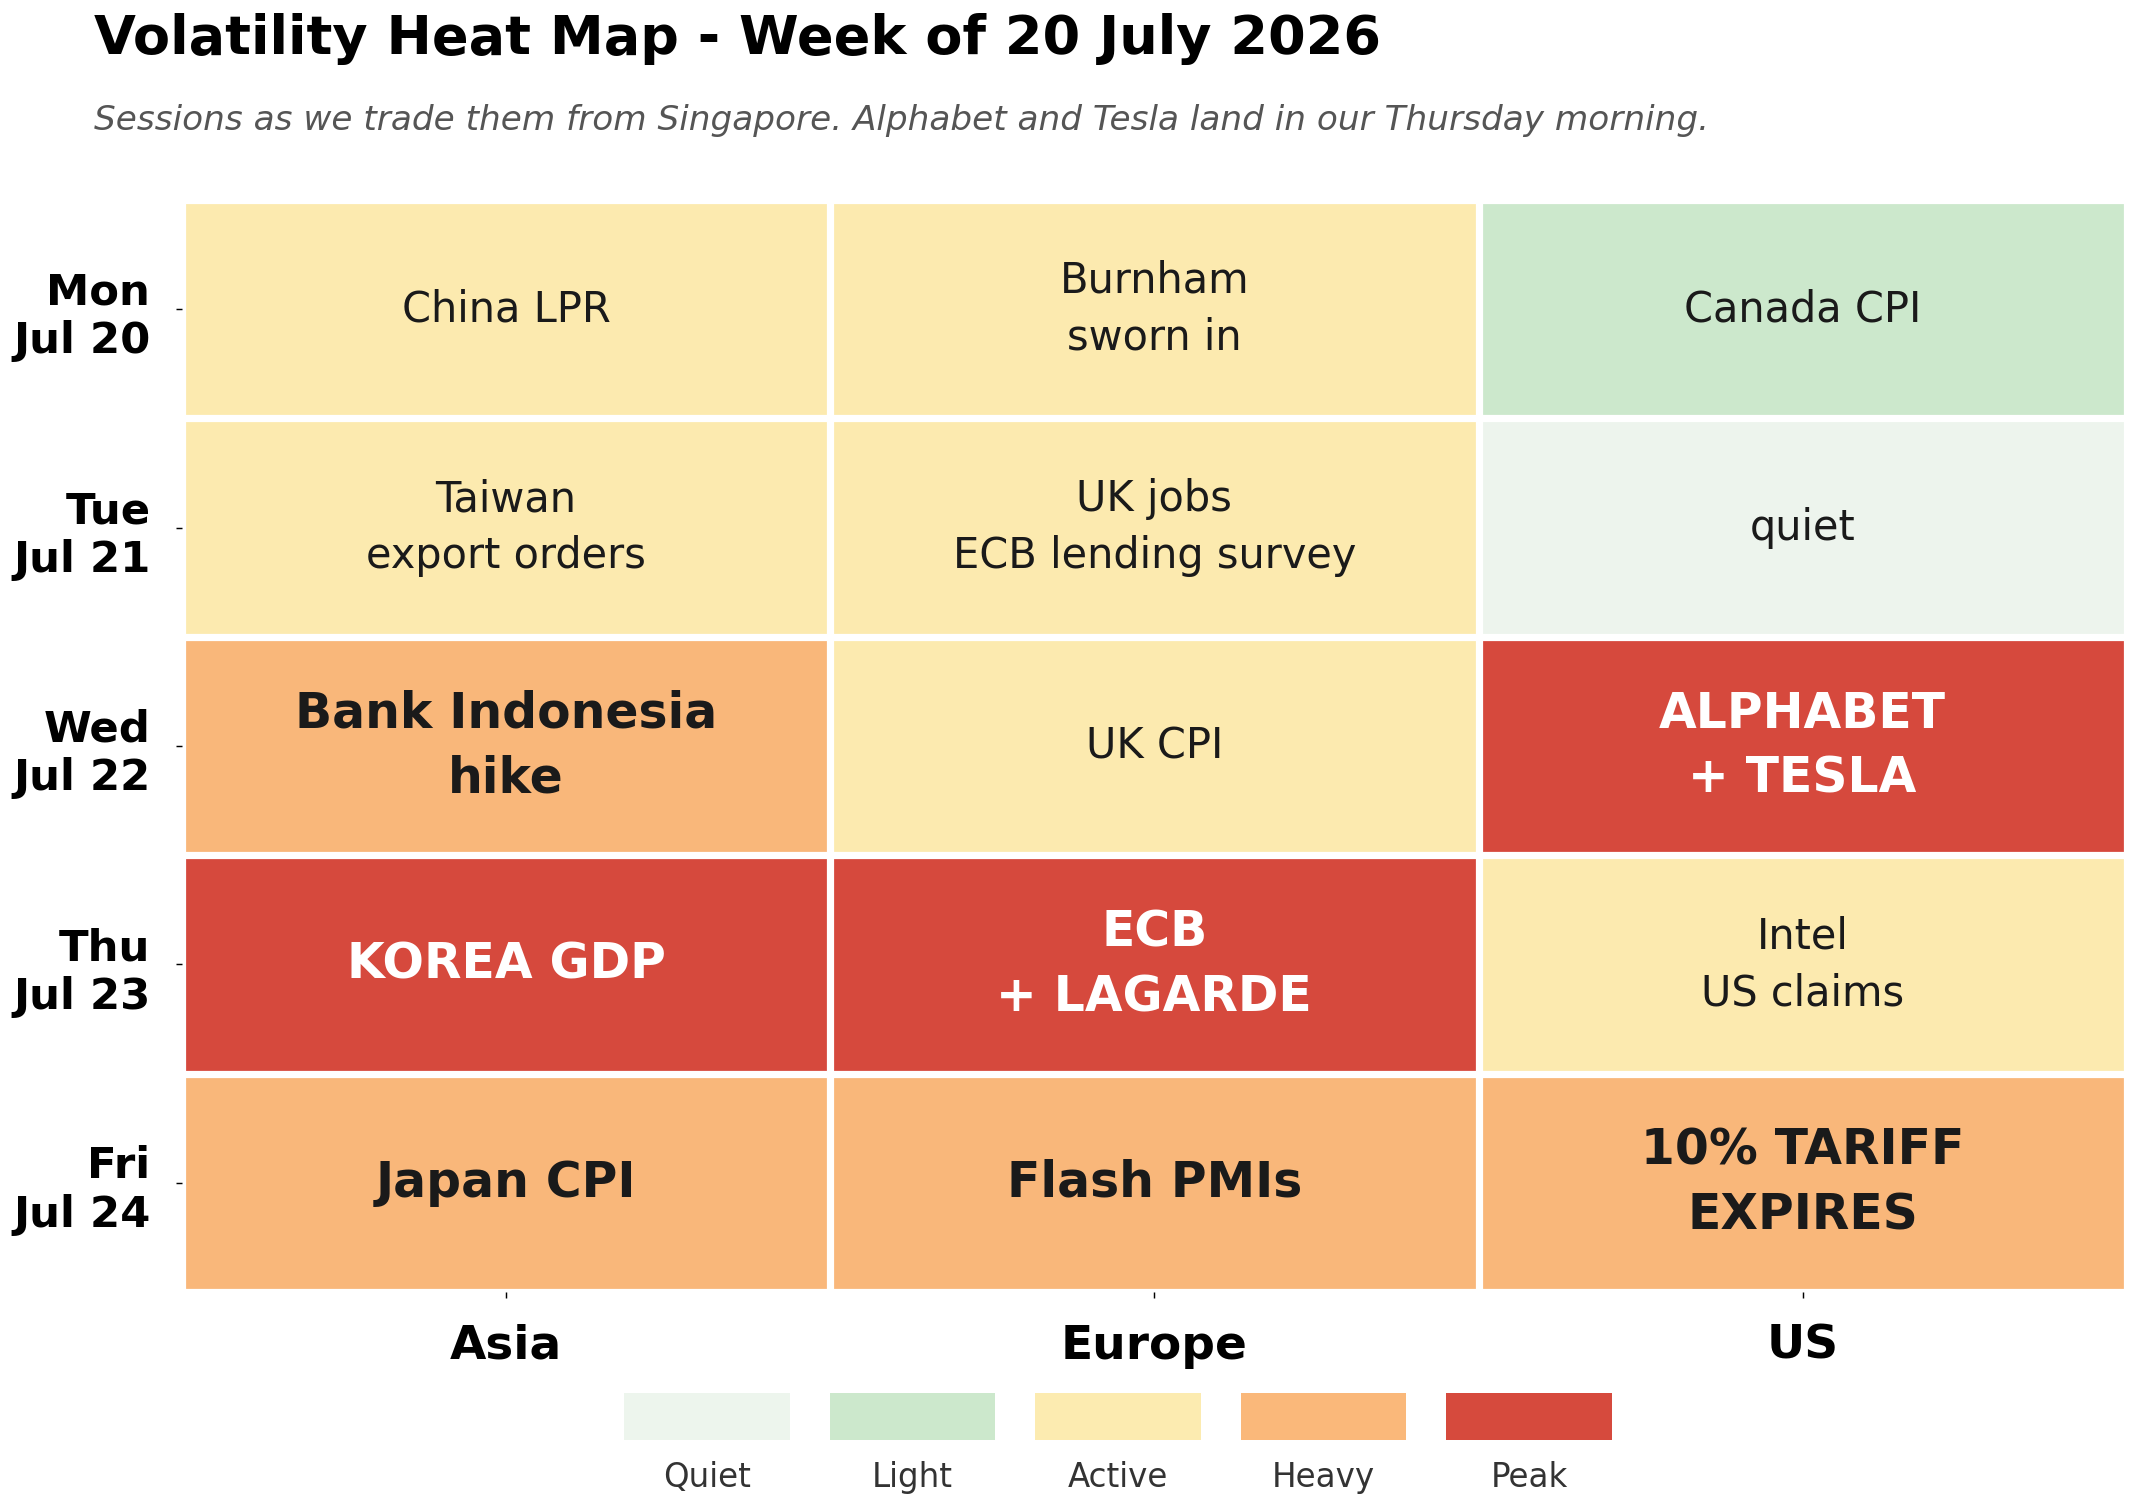
Volatility heat map for the week ahead, sessions as we trade them from here. Wednesday's Alphabet and Tesla numbers cross after the New York close, which puts them in our Thursday morning, and they are the first read on AI capex since the chip complex broke. Thursday is the heavy one at both ends, Korean GDP in our morning and the ECB with Lagarde in the afternoon. Friday brings the global flash PMIs, Japanese CPI and the expiry of the temporary 10% US import tariff. Burnham takes office Monday. And behind all of it the Strait of Hormuz stays closed, with oil no longer politely retracing.
"This is a great time to buy!!! DJT" — Donald Trump on Truth Social, 9 April 2025. Remember this one? Hours after the post the S&P 500 rallied 9.5%, a historic one-day move and among the largest single-session gains the index has ever printed, as the White House blinked and paused its tariffs. Fifteen months on, Trump Media has reportedly pitched a $100,000 monthly fee for a fast feed of the president's posts. You cannot make this up. A market-moving wire sold by subscription to whoever can pay is insider access with a price list, and it lands in a week when a single post could move the oil price more than any scheduled release on the calendar. The edge was never the information. It was getting it first.
"Building railroads from nowhere to nowhere is not a viable business." — Liaquat Ahamed, author of 1873, drawing the parallel to today's data-centre buildout. He was talking about data centres. Through the 1850s and 60s the world's first genuinely cross-border bond market financed a railway boom on a single premise, that growth would keep compounding fast enough to service the debt raised against it. The crisis of 1873 did not begin when the railways stopped growing. It began when they stopped growing fast enough. In calculus the first derivative is velocity, how fast a number is moving, and it is explicit and codified, the sort of thing an algorithm reads off a headline in milliseconds. The second is acceleration. The third is whether the acceleration itself is starting to give way. Markets are built to see the first two clearly and the third almost never, because that last one is not a number yet, it is a feel for the curve before the ledger admits it. This quarter's earnings calls and backlog disclosures read like a story about growth. The question underneath them is whether the acceleration has already begun to fade. Explicit knowledge is herd knowledge, and by the time it is written down it is priced.
"Risk isn't what you think is going to happen. It's what hurts if it happens. Exogenous is the likelihood of a lightning strike. Endogenous is the amount of dry grass and trees on the ground that could catch fire if and when the lightning strikes. We focus on the endogenous risk, that is, where the fire could do the most damage." — David Dredge, Convex Strategies. The lightning is easy to name this week. The semiconductor complex fell into a bear market, down 20% from its record and the worst week since the April 2025 tariff rollout, with individual memory names off more than 30% from their highs, while Korea's index has already broken and its central bank has started hiking into it. The harder question is the one Dredge actually asks. Where is the dry grass? Part of the answer is in the correlations, because Korea runs about 0.88 with the semis complex, Taiwan 0.84, the Nasdaq 0.84 and Japan 0.79, so a chip unwind is never a local event. The nearer fuel is leverage, retail margin money that piled in at the top. The deeper fuel is the financing under the data-centre buildout and the loan-securitisation market beneath it, where the riskiest tranches are already posting their worst returns in years. That is a different question from whether any single stock is expensive, and it is the one worth stress-testing.
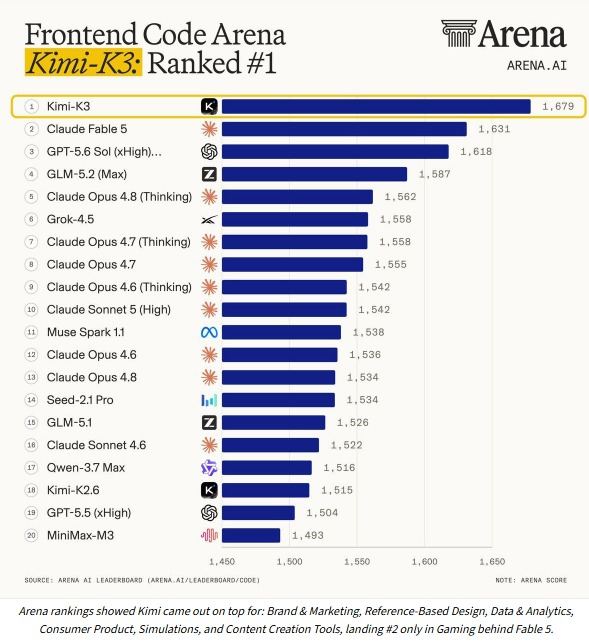
The chart that repriced a trade in a single afternoon. Moonshot's Kimi-K3 took the top of the Frontend Code Arena at 1,679 points, ahead of Fable 5, GPT-5.6 and the Opus and Grok families, a seventeen-place jump from its own previous model and a first place in six of seven domains. Full weights are due to be released to anyone who wants them. This is what a DeepSeek moment looks like on the second visit, and it is not really a story about one leaderboard. If frontier-quality output is open and close to free, the question is not who wins the benchmark. It is what a token is actually worth, and every capex line built on the old answer has to be re-underwritten. Source: Arena (arena.ai). Read more
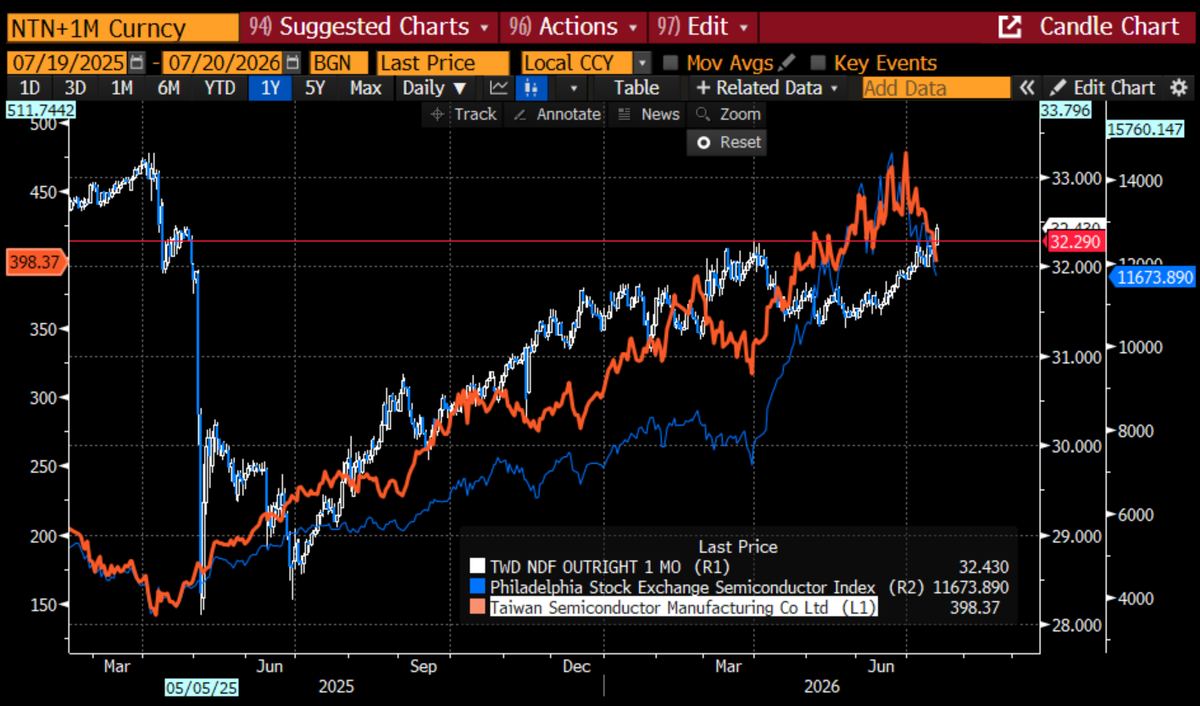
The same story, priced in Taiwan dollars. The one-month TWD outright has closed above resistance, tracked here against the semiconductor index and the largest foundry in the world, and the three lines have stopped agreeing. Dividend season is about to send offshore payments out, equities are sluggish, and the shorts that spent months earning carry on positive forward points are the ones now being squeezed. This is the cleanest expression of the week's real question. When the chip cycle wobbles, Asian currencies do not decouple from it, they transmit it, and the pressure shows up in the funding leg before it shows up in the index. Source: Bloomberg.
What is the plan this week?
Equities will have to face another testing week ahead. The Middle East continues to escalate, more casualties, and oil prices sailing higher with little resistance. Thinner inventories and China showing some restocking may be the narratives fuelling it from below. My thesis of inflation tamed with oil prices back at the lows is totally reversed. The strait has been closed since Monday, a naval blockade is being enforced, and a fresh sixty-day campaign has been notified to Congress, so the easy retracement that saved the June inflation prints is not available a second time. The shock will be across central bank monetary policy again, with the ceasefire having given everyone some false hope of calm.
Though the Fed July hike pricing has come down to around 20% from 50% on the soft CPI and PPI, I think that raises rather than lowers the chance that Chair Warsh delivers an insurance hike at the FOMC later this month. The June print was bought with an oil price that has since reversed. Headline CPI fell 0.4% on the month and the annual rate dropped to 3.5%, which is genuinely good news about last month and tells you very little about the next three. A chair who dislikes forward guidance, who has just told Congress he does not think everything is swell, and who has built a task force around defeating inflation through credibility, is not the profile of someone who wants to be seen waiting.
In the tech world the ground moved twice. Meta is selling compute to Anthropic while Moonshot's Kimi took the lead in the new model rankings, a DeepSeek 2.0 moment as people are calling it, and it does mean we have to rethink how much a token is actually worth. A few weeks ago I pointed out Musk re-entering with Grok and plenty of compute. Now the top of the leaderboard is an open model whose weights are about to be published. And at the other end of the chain, the Kospi and the chips are breaking the foundation, the semis index into a bear market and the memory names off a third from their highs, with IBM posting its first negative pre-announcement in more than two decades in the same week TSMC raised capex guidance to sixty billion and above. Truly a perfect storm all round.
The plan this week is to focus on where the pain is. Towards the end of last week I felt that oil prices have gone through a comfort zone, or rather that the hope of an easy TACO is not possible this time. USD Asia will have to come under renewed pressure higher. The question is the reaction function. Will it be the same as the first round of the oil move, when Asian central banks leaned against the currency and the curves held, or has the accumulated damage from the chip break changed what they can afford to defend? Korea has already hiked into a falling equity market. Indonesia is expected to hike on Wednesday with the rupiah at the weak end and index providers openly discussing a downgrade. Taiwan is the one I am watching most closely, with the one-month outright closing above resistance into dividend season and a squeeze building on the carry shorts.
So the book leans the other way from the last few weeks. Long USD against the Asian complex rather than short it, sized for a grind rather than a gap, with the chip correlation as the confirming signal and a break back below the recent ranges as the stop. If the Fed is going to hike, how will Asia curves stay where they are? That is the question the whole region has to answer before the end of the month, and this week is where it starts getting asked properly. Stay nimble.
What did I learn last week?
Mon Jul 13: Iran declared the Strait of Hormuz closed indefinitely and the two sides traded strikes overnight. Japan was out for Marine Day. China left its loan prime rates alone. The tape opened the week treating a closed strait as a headline rather than a regime, which in hindsight was the mistake.
Tue Jul 14: US June CPI fell 0.4% on the month against expectations of a 0.1% decline, dropping the annual rate to 3.5% from 4.2%, with the Atlanta sticky measures decelerating hard. Warsh testified to the House without commenting on the rate path, though he pushed back in questions on the idea that everything is swell. The US Navy began enforcing blockade conditions on Iranian ports that evening. Bank earnings came in strong on advisory fees and trading.
Wed Jul 15: China Q2 GDP printed 4.3% year on year against 4.5% expected, the weakest since late 2022, with fixed-asset investment down 5.7%, the largest contraction since 2020, and retail sales the lone upside at 1.0%. The Bank of Korea raised its seven-day repo 25bp to 2.75%. PPI came in cooler than expected. The Bank of Canada held at 2.25% and quietly dropped its language about consecutive hikes and cuts.
Thu Jul 16: IBM issued its first negative pre-announcement in more than two decades, missing on both earnings and revenue. TSMC beat comfortably and raised full-year capex guidance to sixty to sixty-four billion dollars from a prior high end of fifty-six, with revenue growth now seen slightly above 40%. ASML beat and flagged memory revenue up 75%. The yuan fix was set at a new three-year low. A Fed regional president called publicly for modestly higher rates.
Fri Jul 17: Moonshot released Kimi K3 and it took the top of the Frontend Code Arena, with full weights due for public release on 27 July. The semiconductor index closed in a bear market, 20% off its record and the worst week since April 2025. SpaceX broke below its IPO price with about a trillion dollars gone from the peak, and Oracle made new lows for the year. Michigan sentiment came in at 54.4 against 51.0 expected.
All week: The S&P fell 1.6%, the Dow 0.9% and the Nasdaq 2.9%, with the damage concentrated entirely in the AI stack. Pricing for Fed tightening by December collapsed from around 43 basis points to 26 or 27, the least since the day before the June meeting. The dollar fell against every G10 currency except the yen, with the index chopping from its late-June peak near 101.80 down to 100.35 before recovering. The gap between a soft inflation print and a closed strait is the whole story of the week.
What to look out for next week?
Mon Jul 20: Andy Burnham is sworn in as UK prime minister, the seventh since the Brexit vote, and the Chancellor appointment is the only part markets will price. China sets its loan prime rates, expected unchanged for a fourteenth month. Canada CPI is seen easing to around 3.05%. German PPI, Malaysian and New Zealand trade, US leading index. The Farnborough airshow opens with the order book the thing to watch. The Fed is already in blackout ahead of the 28 to 29 meeting.
Tue Jul 21: Taiwan export orders are the first hard read on whether the chip break is a price event or an order-book event. New Zealand CPI is forecast to surge on the energy shock. UK jobless claims, unemployment and public finances land into the new government's first full day. Germany ZEW and the euro-area bank lending survey, the latter two days before the ECB and pointing the wrong way for the hawks. The ASEAN foreign ministers meet in Manila through Friday.
Wed Jul 22: Alphabet and Tesla report after the New York close, which puts the numbers in our Thursday morning, and the capex line matters more than the earnings line. Bank Indonesia is expected to hike with the rupiah at the weak end. UK CPI is seen slowing to 2.7%. Japan trade, Taiwan unemployment, South African CPI. Samsung holds its Unpacked event in London. Any change to AI capital spending plans is the single most market-relevant sentence of the week.
Thu Jul 23: The ECB is expected to hold at 2.25% and the entire event is Lagarde on September, which traders are convinced of and economists are not, into a bank lending survey that undercuts the case and an energy shock that has resumed. South Korean GDP overnight is the week's most underpriced release. Australian unemployment, Singapore CPI, Taiwan industrial production, Turkey and South Africa rate decisions, US claims. Intel reports.
Fri Jul 24: Global flash PMIs across the euro area, Germany, France, the UK, India and Japan, the first survey evidence covering the period since the strait closed. Japan CPI is expected to re-accelerate toward 1.8% headline. UK retail sales, US new home sales and building permits. The temporary 10% US global import tariff expires unless Congress extends it. Russia sets rates. Ratings reviews for Turkey, the Czech Republic and Tunisia.
Beyond next week
Jul 27: Moonshot publishes the Kimi K3 weights, at which point frontier-class coding capability is free to anyone who can host it.
Jul 28-29: FOMC. Market pricing has July down near 20%, which is precisely why an insurance hike would land as a shock.
Jul 30: US Q2 GDP and June PCE, plus the shareholder vote on the contested loan-fund mandate that has become the sector's proxy fight.
Aug 7: US July payrolls, the seasonally weak print that has twice turned a policy cycle.
Aug 11: RBA, with Australian participation masking more labour-market softness than the unemployment rate shows.
Sept: The ECB hike the market believes in. Between now and then sit two CPI prints and an oil price nobody can forecast.
Ongoing: Hormuz. A closed strait, an enforced blockade and a notified sixty-day campaign. There is no scheduled date on which this resolves.
Regimes
The oil thesis reversed, and the second move will not trade like the first. I had inflation tamed by oil returning to the lows. The strait has been closed since Monday, the blockade is being enforced and crude is climbing with little resistance, on thinner inventories and Chinese restocking. The first oil move was met with central banks leaning against currencies and curves holding. The second arrives with an equity complex already broken and less policy room. Fade nothing here. The trade is to respect the direction and stop assuming the retracement, with long-dated crude calls still the cheapest insurance against the scenario nobody wants to underwrite. reversed, war week 7
Warsh delivers an insurance hike, and the low pricing is the reason it works. July pricing has fallen to roughly one in five on the soft prints, and December tightening has collapsed to 26 basis points from 43. That is exactly the setup in which a chair who dislikes forward guidance, who has staffed his inflation task force with credibility hawks and who has just declined to celebrate a good CPI, can move without being accused of following the market. The trade is to be positioned for a front-end shock rather than to predict it, cheap payers into the meeting, and to treat a hold as the outcome already in the price. new, week 1
A token is worth less than the capex assumed, and the chips are repricing it first. An open model took the top of the leaderboard with weights due for publication, the cheapest Chinese models run two orders of magnitude below the Western frontier on cost per task, and their share of US enterprise routing is near 60%. Meanwhile the semis index is in a bear market and memory names are off a third. The trade is to keep fading strength in the AI hardware complex on rallies rather than chasing the break, and to watch Wednesday's capex guidance as the confirming or invalidating signal. evolved, week 12
USD Asia higher. The book flips. This is the reversal. For six weeks the position was short USDJPY and USDKRW into a dollar correction. The correction is over. The yen was the only G10 currency to fall against the dollar last week, the yuan fix printed a three-year low, the rupiah is at the weak end into a hike, and the Taiwan dollar one-month outright has closed above resistance with dividend season and a carry-short squeeze both arriving. Long USD against the Asian complex, sized for a grind not a gap, with the chip correlation as confirmation and a break back inside the old ranges as the stop. reversed, week 8
Balance-sheet fragility is now credit, not just equity. The riskiest slice of the 1.3 trillion dollar loan-securitisation market posted its worst returns in years, a listed fund has halved and its managers are fighting in public before a shareholder vote, hyperscaler bonds are among the worst performers in the index, and three separate data-centre borrowers pulled or restructured deals in a week. The trade is to lean against credit-spread complacency and to treat any forced selling in these vehicles as the transmission channel from an equity drawdown into something wider. evolved, week 2
Shifts (if → then)
If Alphabet or Tesla trims AI capital spending Wednesday → the chip break stops being a sentiment story and becomes an earnings revision, semis lead another leg down, Asian equity proxies and their currencies go with it, and the long USD Asia trade pays fastest.
If they raise capex instead and the market sells it anyway → that is the more dangerous outcome, spending confirmed against a token price that has collapsed, and the equity market marking the return rather than the revenue.
If South Korean GDP misses Thursday → the domino the whole thesis rests on, a broken equity market and a decelerating economy in the same week its central bank is hiking, and the won leads the Asian complex weaker.
If Lagarde validates September → the euro squeezes higher into a bank lending survey that argues the other way, Bunds sell off, and peripheral spreads start doing the talking.
If oil takes another leg with the strait still shut → the insurance-hike case builds on both sides of the Atlantic, breakevens catch a bid, and every Asian central bank has to choose between the currency and the curve.
If the tariff expires Friday without an extension → a genuine, scheduled, bilateral shock sitting at the end of a week that already has too much in it, and nobody is positioned for the version where Congress simply does nothing.
If forced selling appears in the levered credit vehicles → the dry grass catches, and an equity drawdown stops being a mark and starts being a liquidation.
Tails
Hormuz stays closed into a second month → this is no longer a tail, it is the base case being repriced. A fifth of global oil and a fifth of LNG, close to 90% of it bound for Asia, with a blockade enforced and a sixty-day campaign notified. The tail is now the resolution, not the escalation. war week 7, evolved
An insurance hike into a bear market in semis → the combination nobody has positioned for, a front-end shock landing on an equity complex that has already broken and an Asian FX market with no cushion left. new
The open-weight release resets AI economics faster than capex can adjust → weights published on 27 July, frontier coding capability free to self-host, and several hundred billion dollars of committed spending underwritten on the assumption that inference stays expensive. new
Korea becomes the transmission rather than the symptom → a bear market, a hiking central bank, a currency at the weak end and a GDP print on Thursday. The correlations say the region does not get to watch this from a distance. week 2, evolved
Forced selling in the loan-securitisation complex → worst equity-tranche returns in years, a halved listed fund, a public governance fight and captive vehicles that removed the outside buyer whose job was to read the documents. new
The UK handover disappoints on the Chancellor → sterling has rallied to a one-year high against the euro through the contest, which means the good news is spent and the appointment only has to be ambiguous to hurt. week 4
Tax-base erosion becomes a fiscal event rather than an essay → two-thirds of US federal revenue rests on labour, coding is the most exposed occupation, tech layoffs are running at 140,000 with AI cited in a quarter of announcements, and claims still show nothing. One of those series is wrong. new, week 1
Handover Monday
The week opens on a transfer of power and a rate that will not move. Burnham is sworn in as the seventh prime minister since the Brexit vote, and the only decision markets will price is who gets the Treasury, because sterling has already rallied to a one-year high against the euro on the assumption of fiscal continuity. China sets its loan prime rates and is expected to sit for a fourteenth month, which after a 4.3% GDP quarter is a statement about how much easing Beijing wants to spend on a bad print. Canada CPI should ease toward 3%. Farnborough opens with the order book worth more than the airshow. And the Fed is already in blackout, which means for the next ten days the only Fed communication is the one that happens on the 29th.
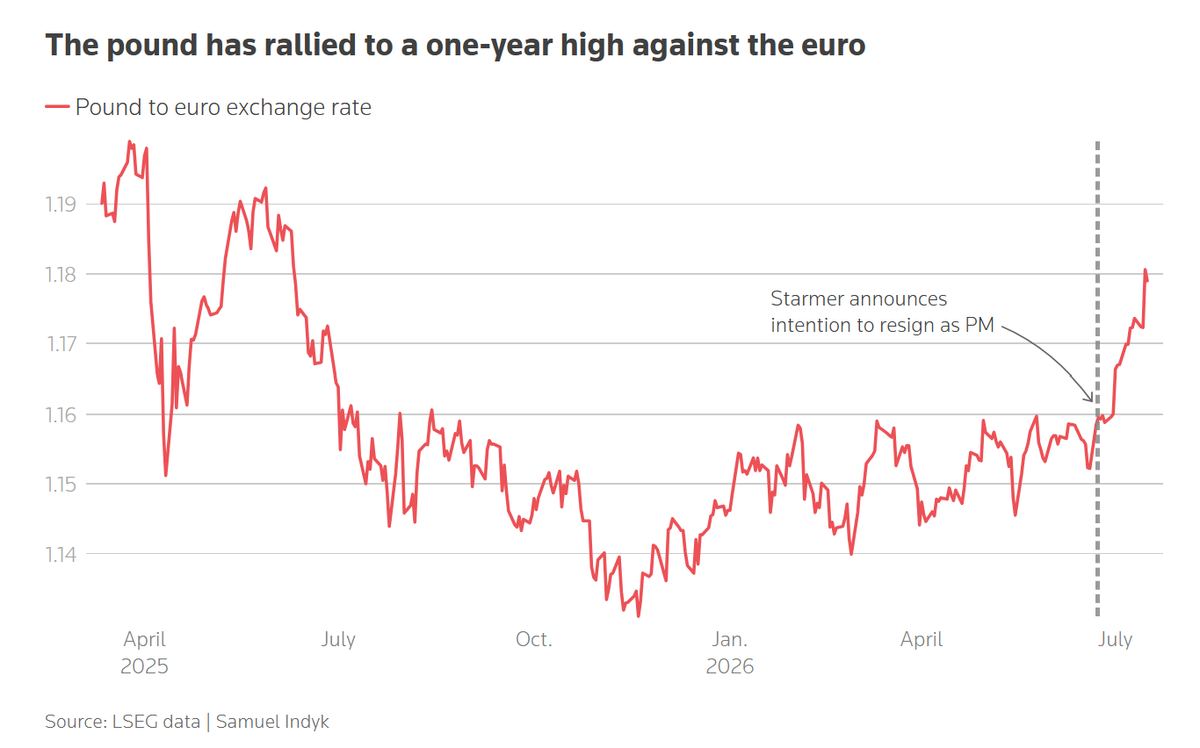
Sterling arrives at the handover from a position of strength, which is the risk. The pound sits at a one-year high against the euro, up close to 3% since late June, having rallied through the leadership contest rather than in spite of it. Burnham is sworn in Monday as the seventh prime minister since the Brexit vote, and the single market-relevant decision is the Chancellor. The market has already paid for fiscal continuity. Positioning that has travelled this far in a straight line does not need bad news to unwind, it only needs an appointment that fails to confirm what is already in the price. Source: Reuters / LSEG.
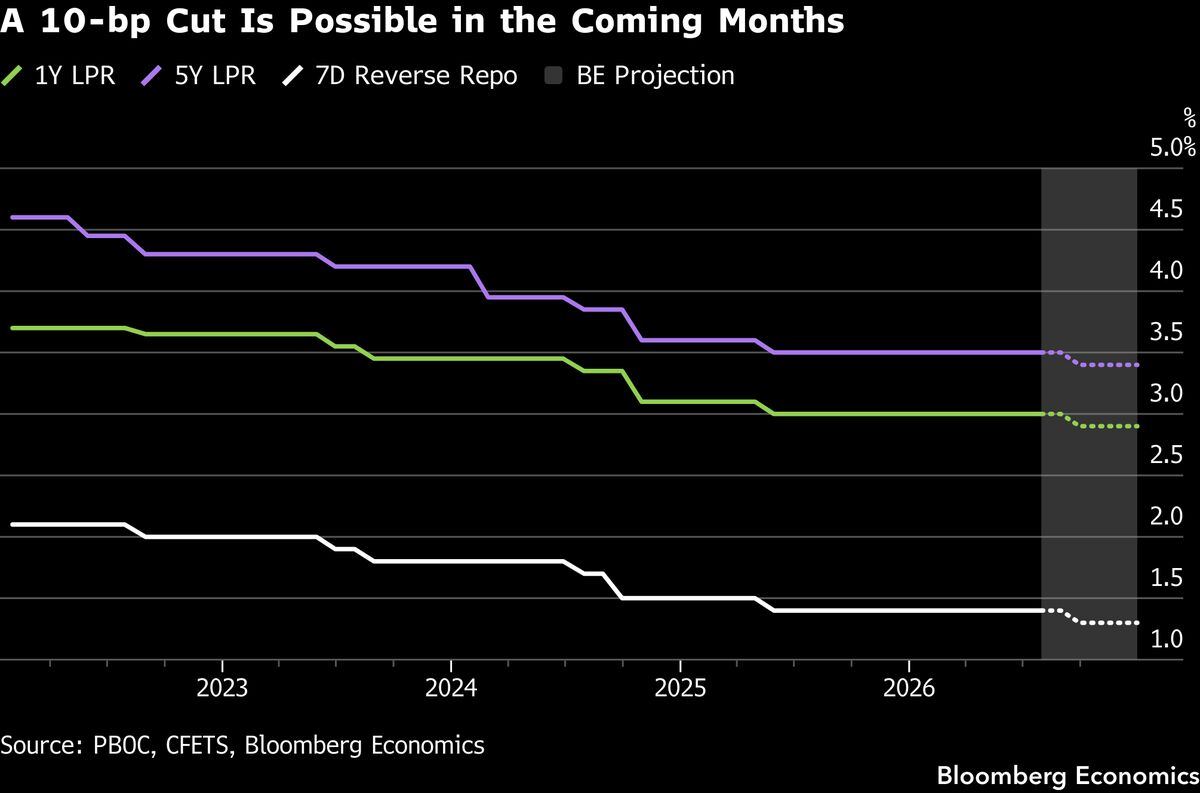
A ten-basis-point cut is live in the coming months, but probably not Monday. China sets its loan prime rates with the one-year at 3.0% and the five-year at 3.5%, expected unchanged for a fourteenth consecutive month, and any surprise would be a 5 to 10 basis point trim. The case for moving has strengthened, second-quarter growth slipped to 4.3% year on year with fixed-asset investment contracting 5.7%, the largest since 2020. Retail sales were the one bright spot. Beijing has been reluctant to spend its remaining easing on a quarter that was always going to be weak, which makes the LPR less a decision than a tell on patience. Source: PBOC, CFETS / Bloomberg Economics.
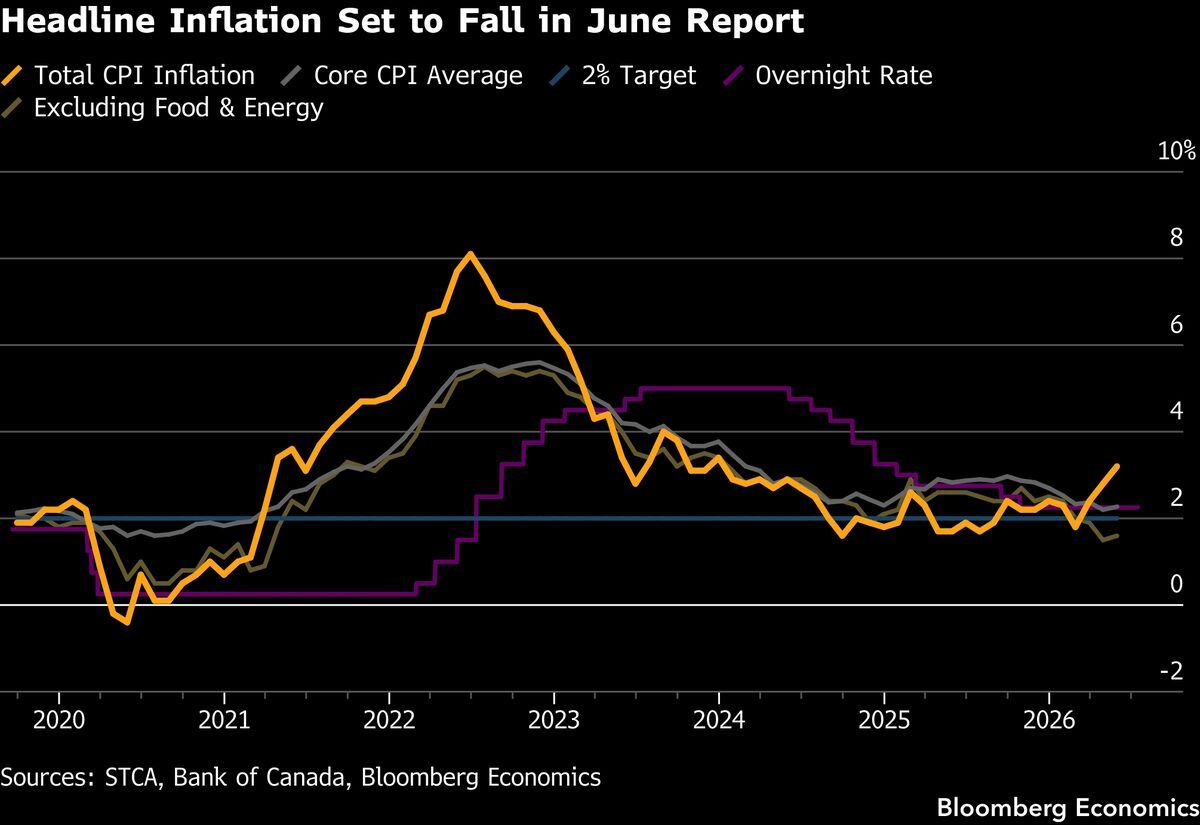
Canadian headline inflation is set to fall in the June report. Consensus looks for a 0.1% monthly decline taking the annual rate to roughly 3.05%, the energy unwind finally reaching the print. The context is less comfortable than the headline, Canadian inflation has run above 7% annualised through the first five months of the year against slightly above 5% in the same period last year, while the median and trimmed core measures averaged around 2.05% in May. The Bank of Canada held at 2.25% last week and quietly dropped its reference to consecutive hikes and cuts, which is the more interesting sentence. Source: StatCan, Bank of Canada / Bloomberg Economics.
Order-Book Tuesday
Tuesday is where the chip break gets its first hard test. Taiwan export orders tell you whether last week was a repricing of sentiment or a genuine turn in the order book, and those two things have completely different implications for the currency. New Zealand CPI is forecast to surge on the energy shock, a useful preview of what a second oil move does to inflation forecasts that were all built on the first one retracing. The UK reports jobless claims, unemployment and public finances on the new government's first full day, and Germany publishes ZEW. The euro-area bank lending survey lands two days before the Governing Council meets, showing credit standards tightening into a September hike the market has already paid for.
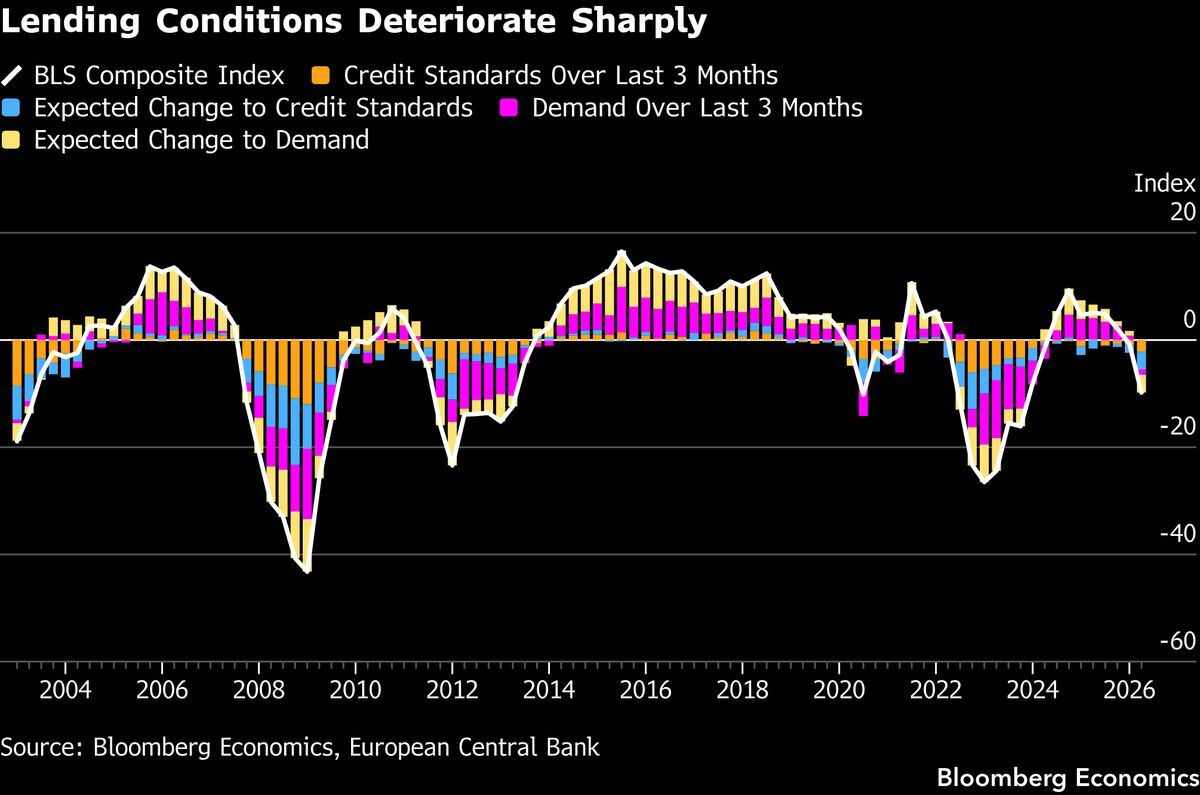
Lending conditions are deteriorating sharply, and the survey lands before the decision. The euro-area bank lending survey is published Tuesday, two days ahead of the Governing Council, with credit standards tightening and expected demand rolling over. It is the transmission channel the ECB actually controls, and it has been moving the wrong way while the headline inflation debate has been about energy. If the September hike the market is convinced of is going to be argued against from inside the building, this is the chart that does the arguing. Source: Bloomberg Economics, ECB.
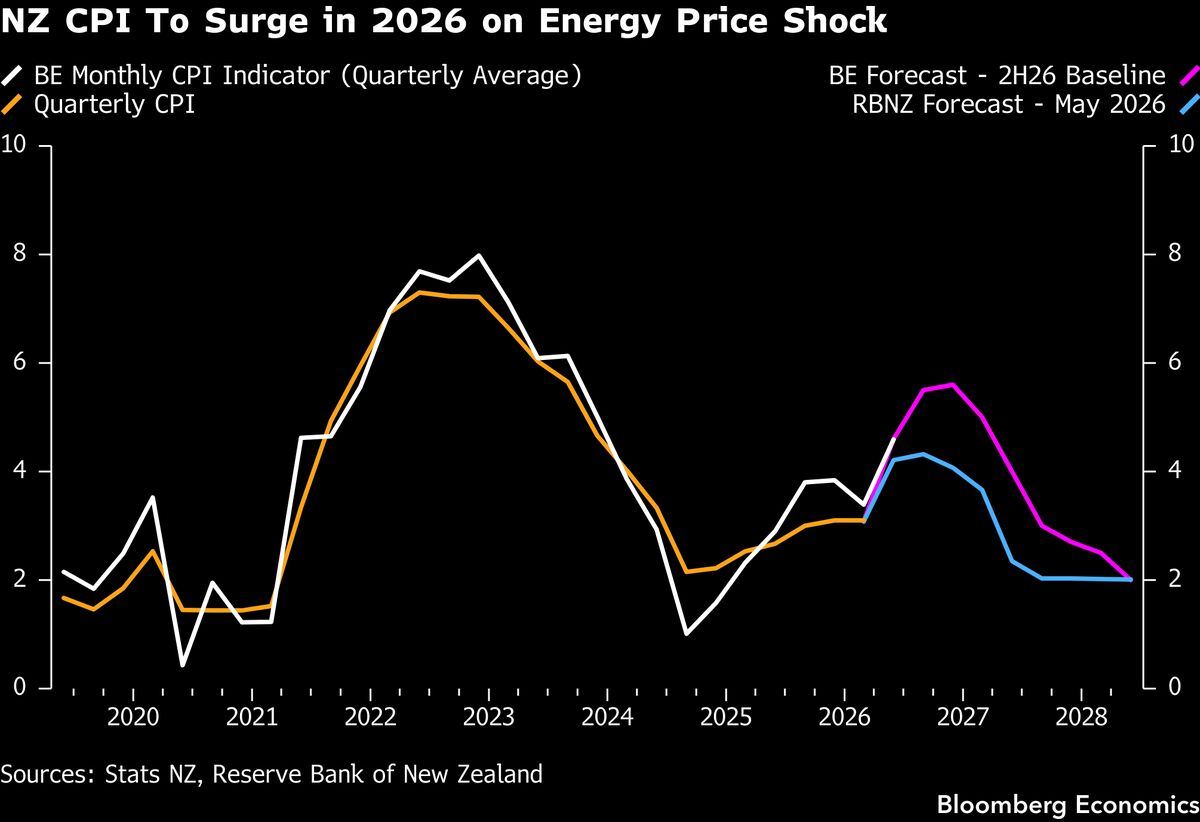
New Zealand is the warning the rest of the region has not priced. The quarterly CPI due Tuesday is forecast to surge through 2026 on the energy shock, well above the target band and above the central bank's own May projection. The lesson travels. Most Asian inflation forecasts still in circulation were built when oil was retracing politely, and the strait has since closed. The reaction function is the question, not the print, because a central bank that hiked into the first oil move has already told you what it does on the second. Source: Stats NZ, RBNZ / Bloomberg Economics.
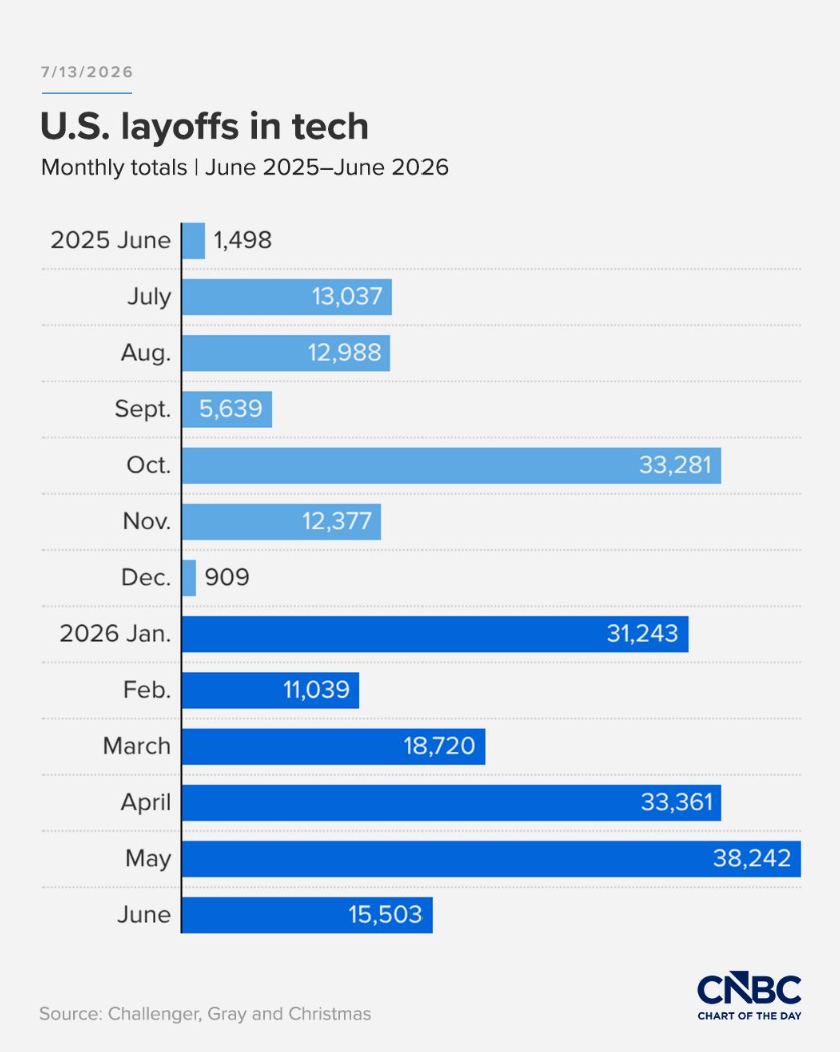
The labour-market damage is arriving through a channel no rate decision touches. US tech layoffs have run near 140,000 so far this year, more than any other industry, with the May peak the highest monthly total since August 2024. AI has been the reason companies gave for a fourth straight month and has been cited in roughly 23% of all job-cut announcements in 2026. This is the quiet counterpart to the capex story, and it lands the same week the UK reports jobless claims and unemployment. Productivity gains and payroll losses are the same event, seen from the two ends of an income statement. Source: Challenger, Gray & Christmas / CNBC. Read more
The Chip Break
This is the spine of the week, so it gets its own section. The semiconductor index fell 20% from its record in the worst week since the 2025 tariff rollout, with memory names off more than a third, and the trigger was not a rate decision. It was a Chinese lab publishing a model that took the top of the leaderboard, alongside margin commentary from the two most important suppliers in the industry. Underneath sits a cost curve where the leading open models run two orders of magnitude cheaper per task than the Western frontier, and a routing share inside US companies that has climbed toward 60%. The capex was underwritten on tokens staying expensive. The chips are the first place that assumption gets marked, and with information technology now roughly a third of the S&P by weight, it does not stay a sector story.
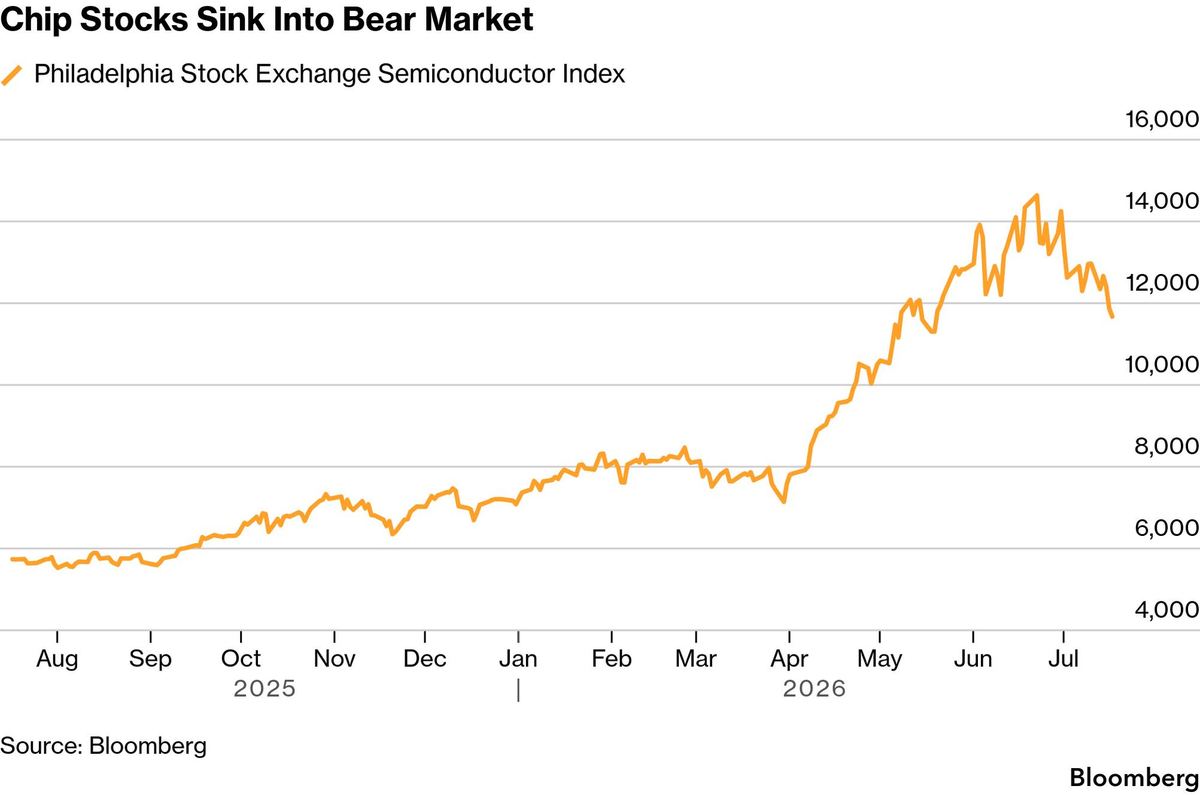
The foundation cracked before the earnings arrived. The semiconductor index fell into a bear market, down 20% from its record and the worst weekly tumble since the April 2025 trade-war rollout, with individual memory and chip names off more than 30% from their highs. The trigger was not a rate move or a data print, it was a Chinese model release and a set of margin comments. A complex that carried the entire index higher for eighteen months does not hand back a fifth of its value on sentiment alone, and the correlations mean this is not a Korean or Taiwanese event. Source: Bloomberg. Read more
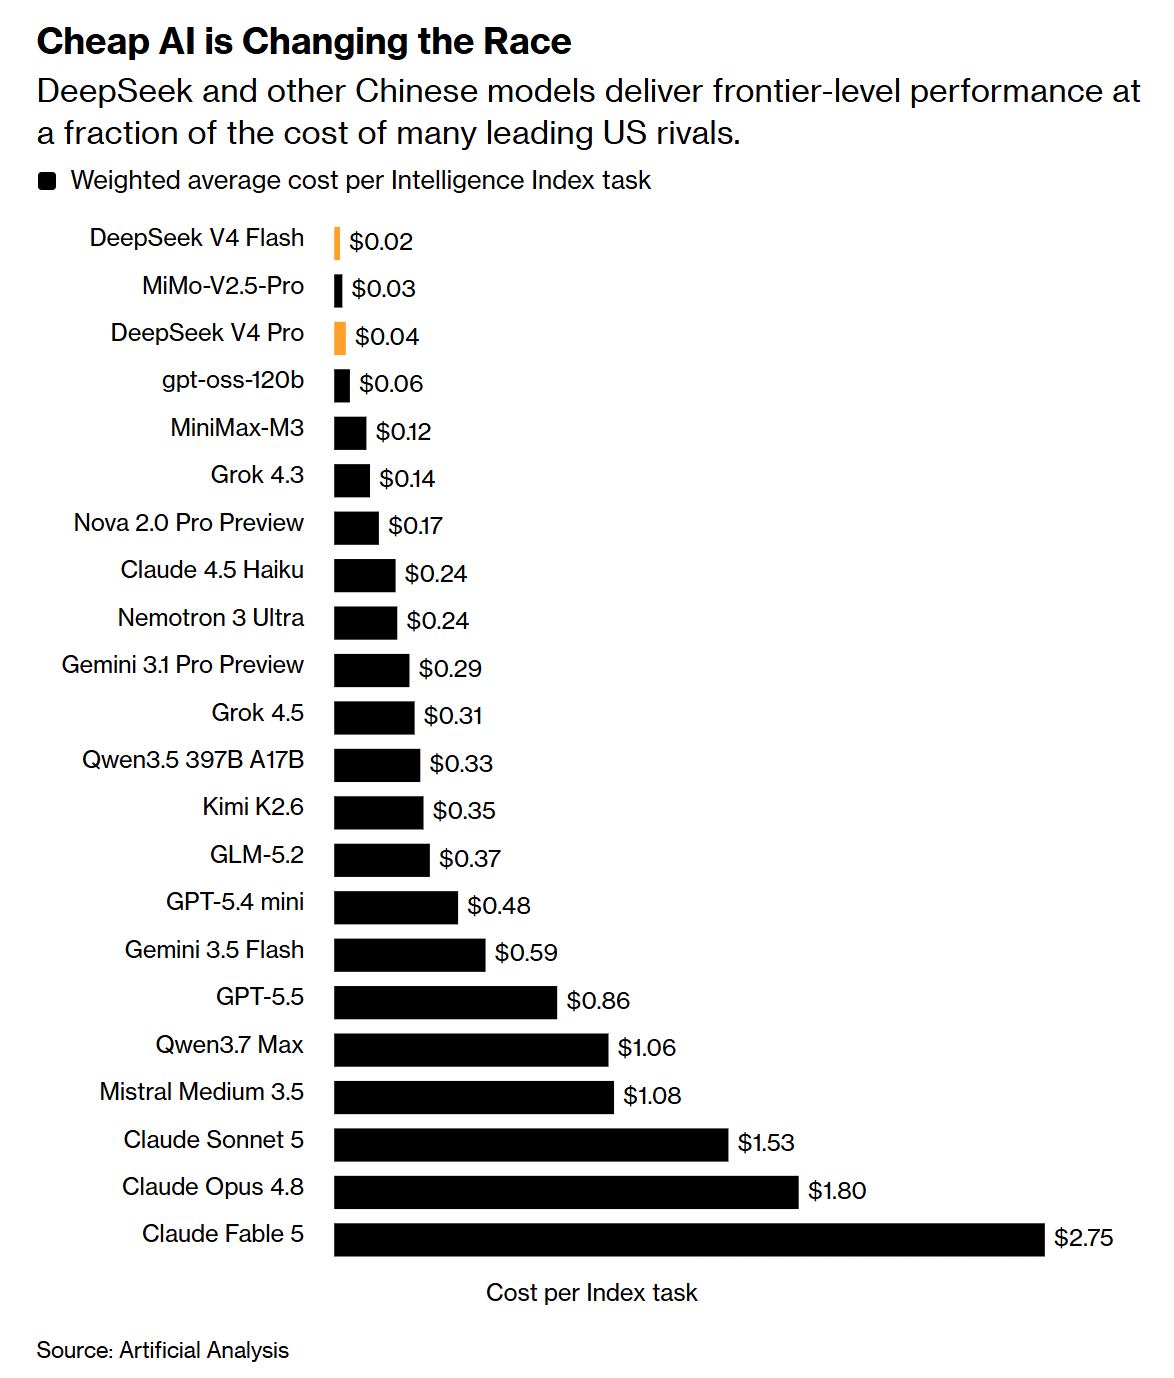
Cheap is the whole argument, and the gap is two orders of magnitude. Ranked by cost per index task, the leading Chinese open models sit at two to four cents against a dollar-fifty to nearly three dollars for the top Western frontier models. DeepSeek has closed a record raise and is planning to list next year, and Moonshot has now taken the leaderboard. Frontier capability arriving at open-weight prices does not just compress margins at the model layer. It resets the denominator under every revenue forecast that assumed tokens would stay expensive, which is the assumption the entire capex cycle was underwritten on. Source: Artificial Analysis. Read more
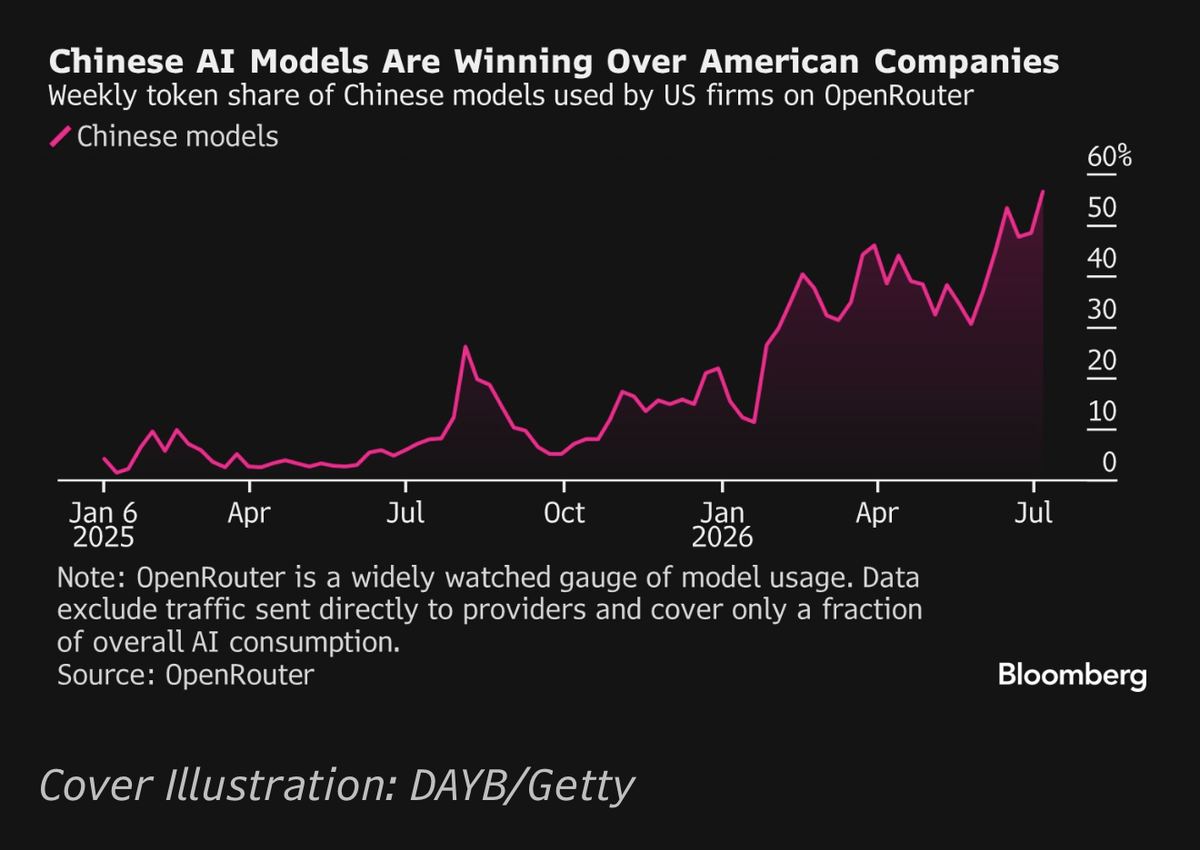
And the substitution is already happening inside US companies. The weekly token share of Chinese models used by US firms on one widely watched routing gauge has climbed toward 60%, a record, and that was measured before the latest release. This is the number that turns a benchmark story into an earnings story. Enterprises are not waiting for a procurement cycle or a policy decision, they are routing to whatever is cheapest that clears the quality bar, and the quality bar was cleared this month. Source: OpenRouter / Bloomberg.
Hyperscaler Wednesday
Alphabet is the first hyperscaler to report since the complex broke, with Tesla the same session, and both cross after the New York close so we read them Thursday morning, and the capital spending line matters far more than the earnings line. Analysts have S&P 500 second-quarter earnings up around 23.7% and the banks have already delivered, so the bar is set at excellent. What the market actually needs to know is whether a single guide gets trimmed. Earlier in our day, Bank Indonesia is expected to hike into a currency at the weak end of a bad year, the cleanest example of a central bank choosing the currency over growth, and UK CPI should slow to 2.7%. Japan reports trade and Taiwan unemployment. Samsung unveils phones in London, which will be the least consequential launch of the week.
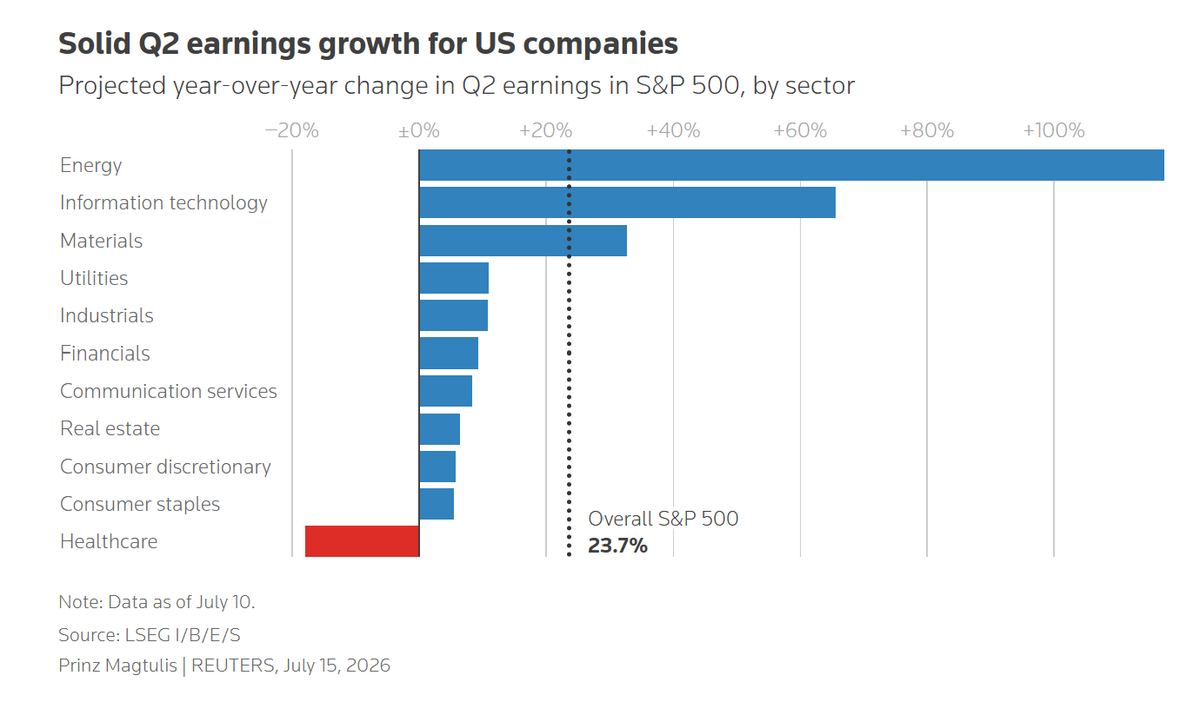
Earnings are expected to be excellent, which is exactly the problem. S&P 500 second-quarter earnings are forecast up around 23.7% from a year ago with more than forty companies already reported, energy and information technology leading by sector and only healthcare negative. The banks delivered, powered by advisory fees and trading. A market near record highs with a bear market in its most important sector underneath it is being asked to accept both facts at once, and Wednesday is when the two are put in the same room. Source: Reuters / LSEG.
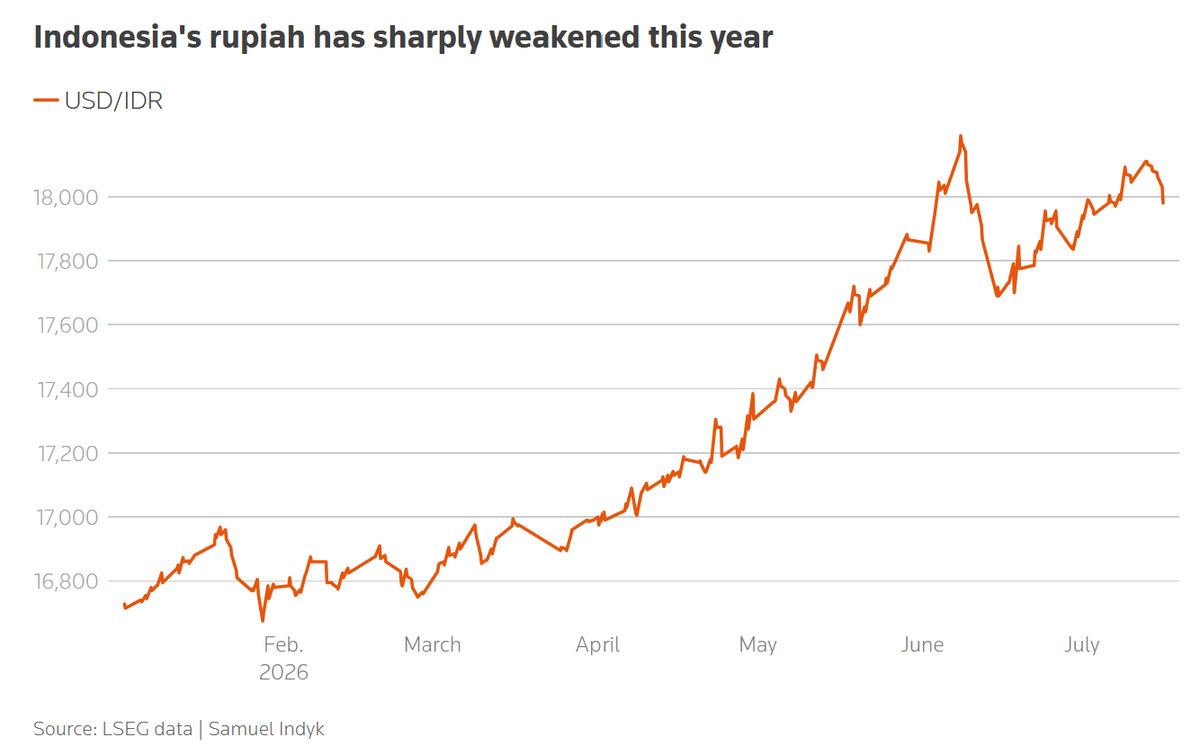
The rupiah is where the Asian funding stress is already visible. The currency has weakened sharply through the year and Bank Indonesia is expected to hike Wednesday, struggling to stabilise it after the country posted its first trade deficit in six years. Index providers have begun openly discussing a downgrade to frontier status. Indonesia is the high-beta version of the pressure now building across the region, a current-account story meeting an oil shock meeting a chip unwind, and it is the one to watch for whether Asian central banks defend the currency or the growth. Source: Reuters / LSEG.
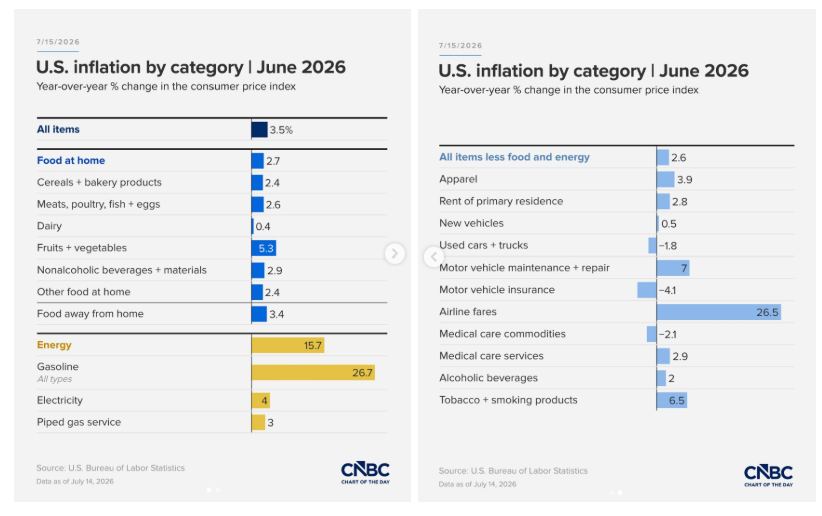
The June inflation print that made everyone comfortable, one week before the oil price stopped cooperating. US CPI fell 0.4% on the month against expectations of a 0.1% decline, taking the annual rate to 3.5% from 4.2%, the first decline in the annual rate since January, with energy and gasoline doing the work. The category detail shows how narrow it was. Sticky measures decelerated hard, which is genuinely encouraging, but the disinflation was bought with an oil price that has since reversed, and the strait closed after the survey period. Source: BLS / CNBC. Read more
Lagarde Thursday
The heaviest session. In our Thursday morning, South Korean GDP is the most underpriced release on the calendar, a first read on an economy whose equity market has already fallen into a bear market and whose central bank raised rates into it last week. Australian unemployment, Singapore CPI and Taiwanese industrial production fill out an Asian morning that is entirely about how much of the chip break has reached the real economy. Then the ECB holds at 2.25% and everything rests on the press conference, because traders are convinced of a September hike, economists are not, the bank lending survey argues against it and the energy shock that justified the last hike has resumed. Intel reports into a broken tape and US claims still refuse to confirm the layoff headlines.
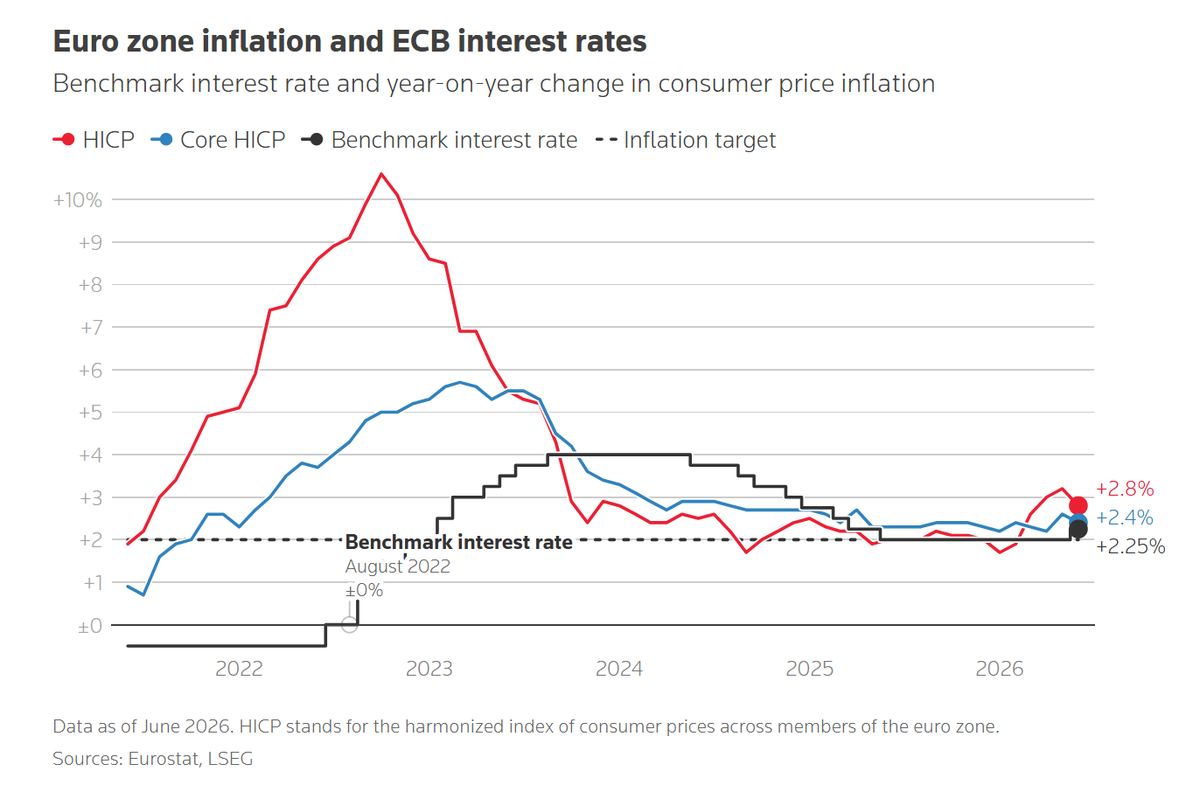
The ECB holds Thursday, and the argument is entirely about September. Having been the first major central bank to hike since the war began, the Governing Council gets to stand still while the oil futures curve sits between its own baseline and milder June scenarios. Traders are convinced of a September move and have started paying for one after it. Economists are not. Lagarde has to acknowledge an energy shock that has resumed without validating a tightening path her own bank lending survey undercuts, which is a narrow line to walk in a press conference. Source: Reuters / LSEG.
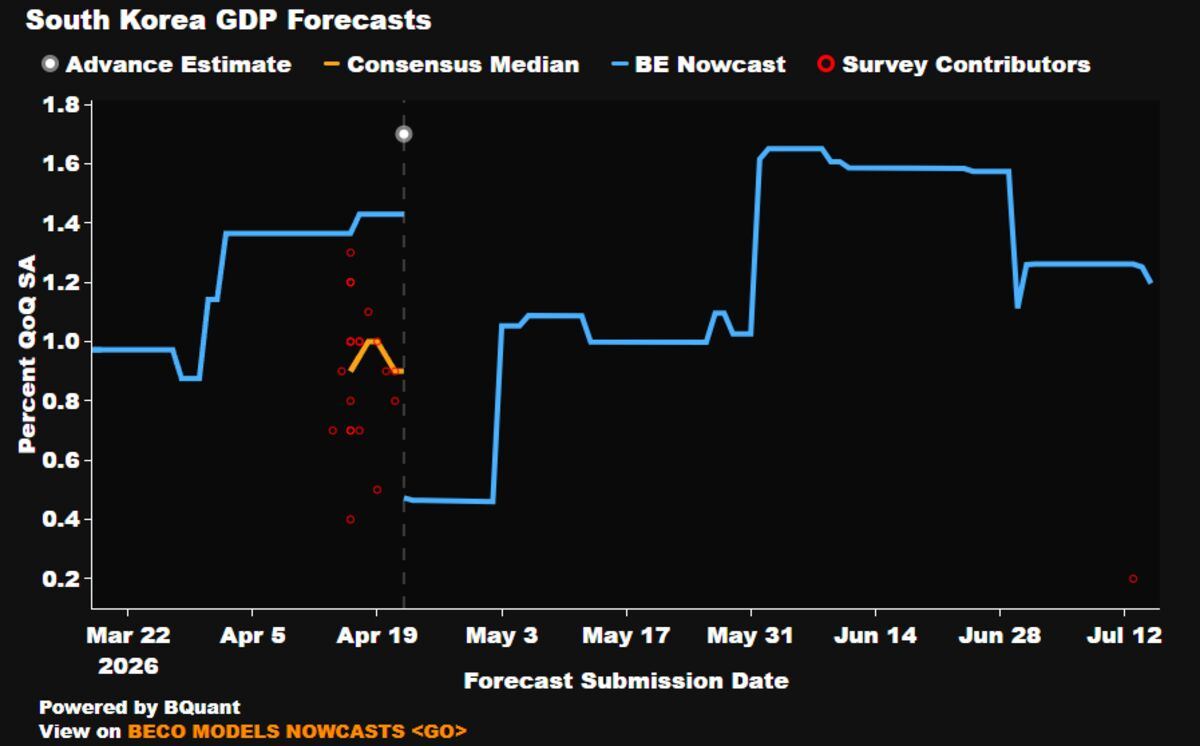
South Korean GDP is the week's most underpriced release. The advance estimate lands in our Thursday morning with forecasts scattered and the nowcast tracking below the consensus median, and it arrives after an equity market that has fallen into a technical bear market and a central bank that raised its policy rate to 2.75% last week. Korea is where the chip cycle, the leverage and the currency all meet in one national accounts release. A soft print alongside a broken semiconductor tape is the domino that would make the rest of the region reprice. Source: Bloomberg Economics.
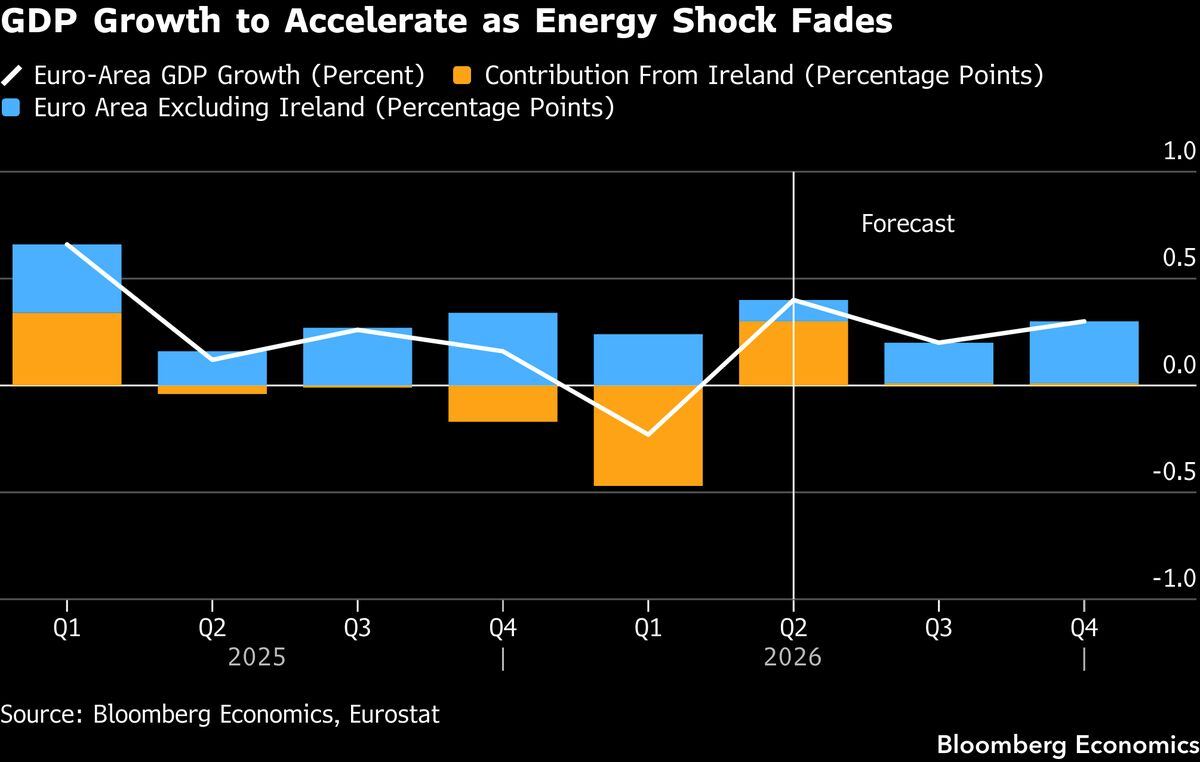
Euro-area growth is forecast to accelerate as the energy shock fades, a forecast the strait has now invalidated. The projection has activity recovering through the second half with Ireland flattering the aggregate as usual. It was built on energy prices retracing. They have stopped retracing. This is the single most consequential stale assumption sitting inside a major central bank's outlook this week, and Lagarde will be asked about it on Thursday afternoon. Source: Eurostat / Bloomberg Economics.
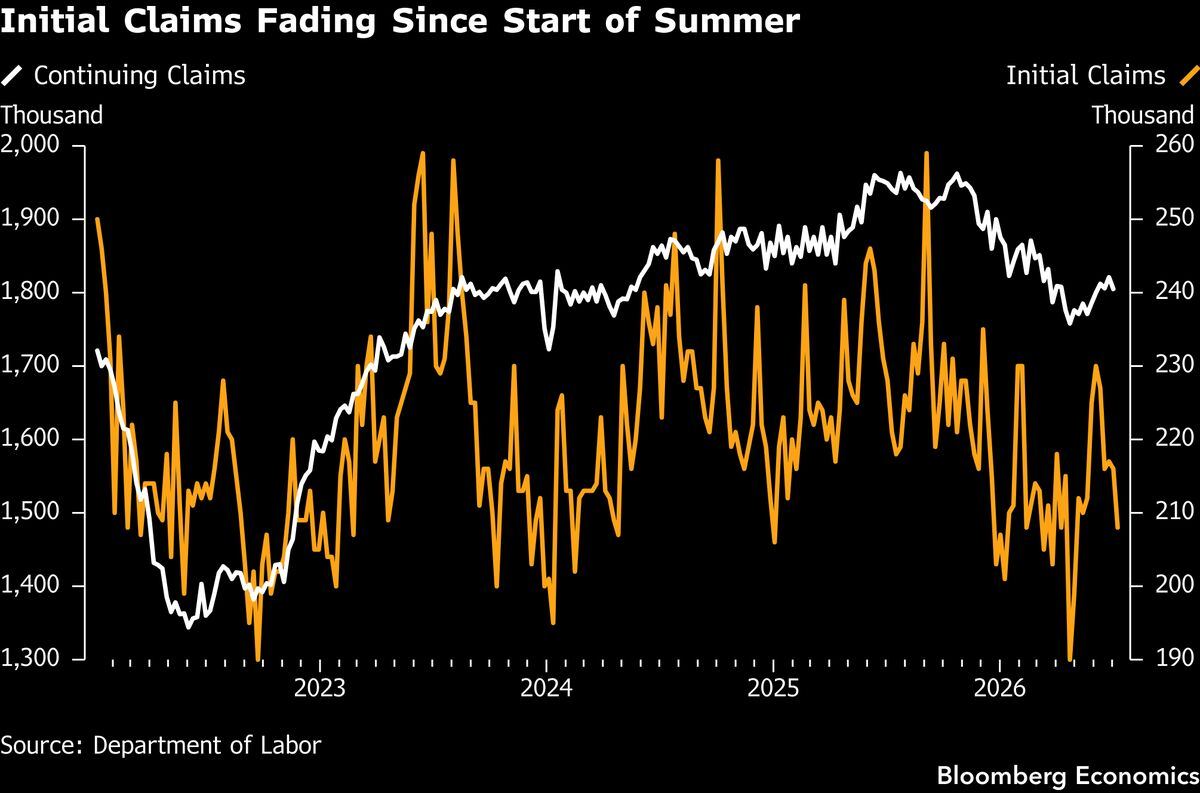
Claims keep fading, which is the case for doing nothing. Initial and continuing claims have drifted lower since the start of summer and print again Thursday, still giving no signal that AI-driven announcements are converting into aggregate unemployment. The gap between the layoff headlines and the claims data is the most important unresolved question in the US labour market. Until it closes, the Fed can treat the job cuts as compositional rather than cyclical, and the hawks keep the floor. Source: Department of Labor / Bloomberg Economics.
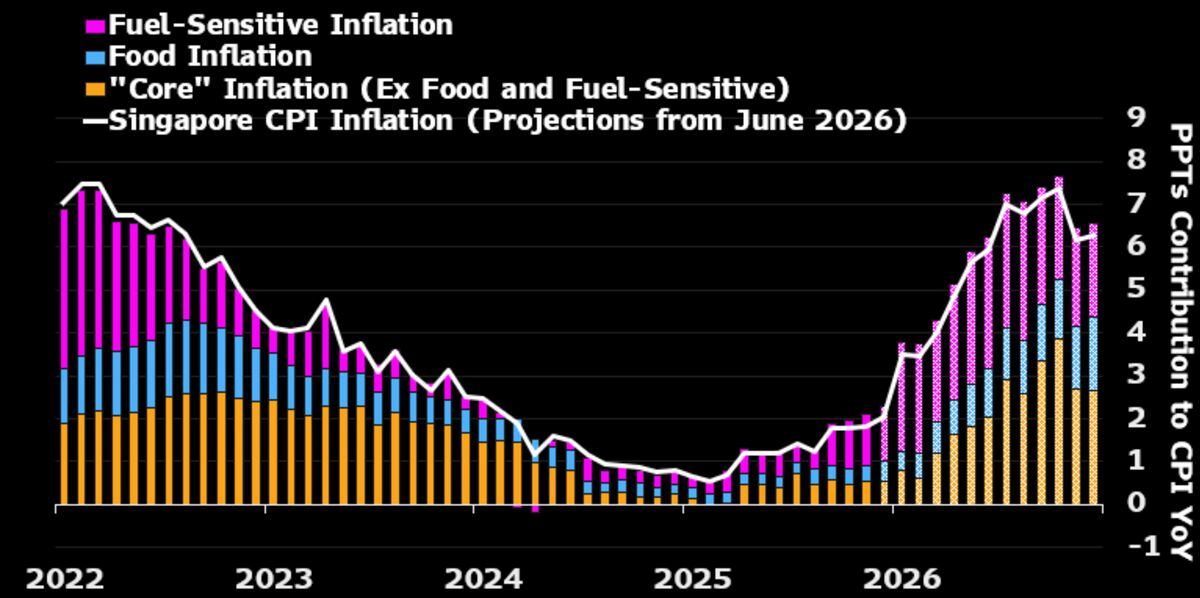
Singapore CPI is the clean read on the oil pass-through. The projection splits inflation into fuel-sensitive, food and core components, and the fuel-sensitive block is the one that moves with the strait. As a price-taking, trade-dependent economy running an exchange-rate policy, Singapore transmits an energy shock faster and more honestly than almost anywhere else. Thursday's print is a useful early read on how much of the second oil move is already in Asian consumer prices. Source: Bloomberg Economics.
Flash Friday
The week ends with the first survey evidence covering the period since the strait closed. Flash PMIs across the euro area, Germany, France, the UK, India and Japan arrive in sequence through the day, and the manufacturing prints are the ones to read, because that is where an energy shock shows up before it reaches a consumer price index. Japanese CPI should re-accelerate toward 1.8% headline, which for an energy importer with the weakest major currency and a finance ministry issuing intervention warnings nobody believes is a genuinely uncomfortable combination. US new home sales and building permits close the American morning. And the temporary 10% global import tariff expires unless Congress moves, a scheduled shock at the end of a week that did not need one.
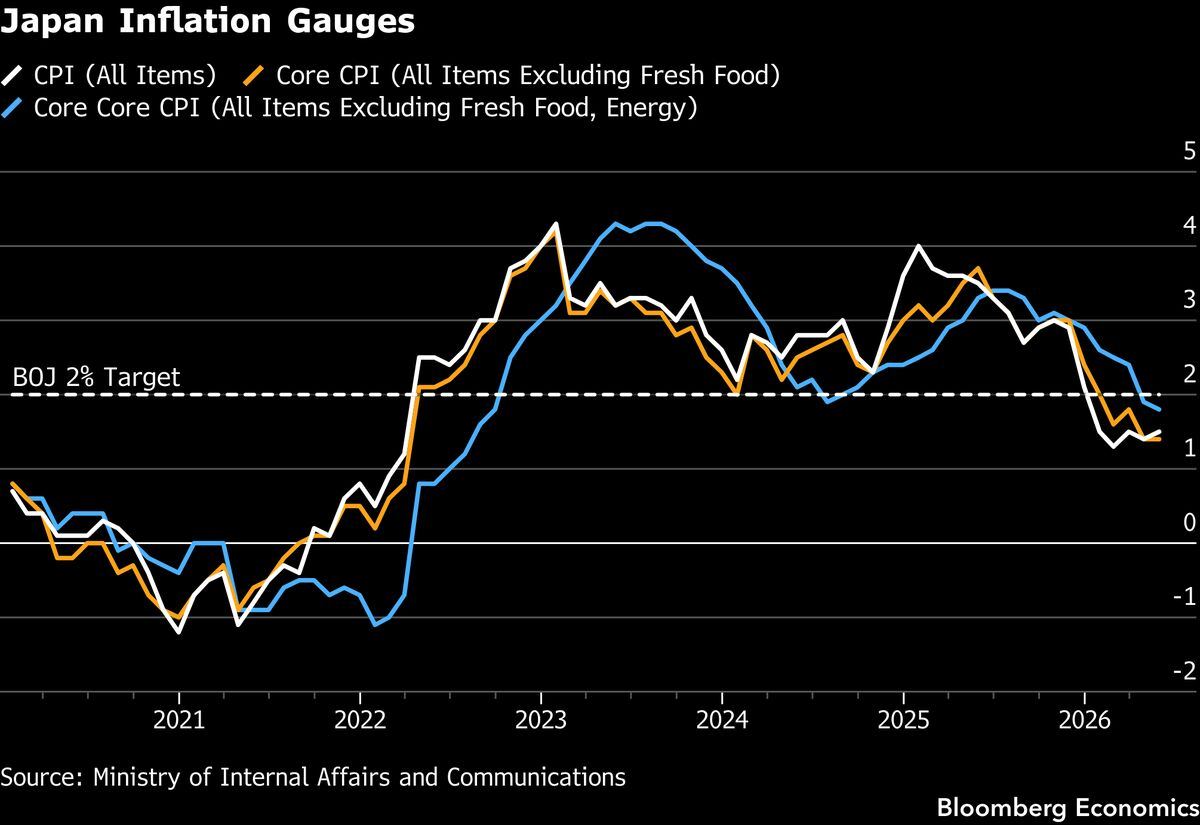
Japanese inflation is quietly re-accelerating into a currency that will not help. Tokyo CPI rose to 1.7% from 1.4% with core to 1.6% from 1.3%, and a similar national move on Friday would put headline near 1.8% and core near 1.7%. The yen was the only major currency to fall against the dollar last week, Japanese investors bought over a trillion yen of foreign bonds in a single week, and the finance ministry renewed an intervention threat the market barely acknowledged. An energy importer with a weak currency and rising core inflation is the definition of a policy trap. Source: Ministry of Internal Affairs / Bloomberg Economics.
Where the Dry Grass Is
The quote at the top of this letter asks where the fire would do the most damage, and the honest answer this week is not in equities, where everyone is already looking. The riskiest slice of the 1.3 trillion dollar loan-securitisation market has posted its worst returns in years, a listed fund holding it has halved over two years and its managers are now fighting publicly over the blame ahead of a shareholder vote. Underneath, a deal-by-deal reading shows the economics were always thinner than the aggregate metric implied, while pools raised by managers to buy their own paper quietly removed the outside buyer whose job was to scrutinise the documents. In the same week, three separate data-centre borrowers pulled or restructured financings and hyperscaler bonds ranked among the worst performers in the index. None of this is a headline market. That is exactly what makes it the fuel load.
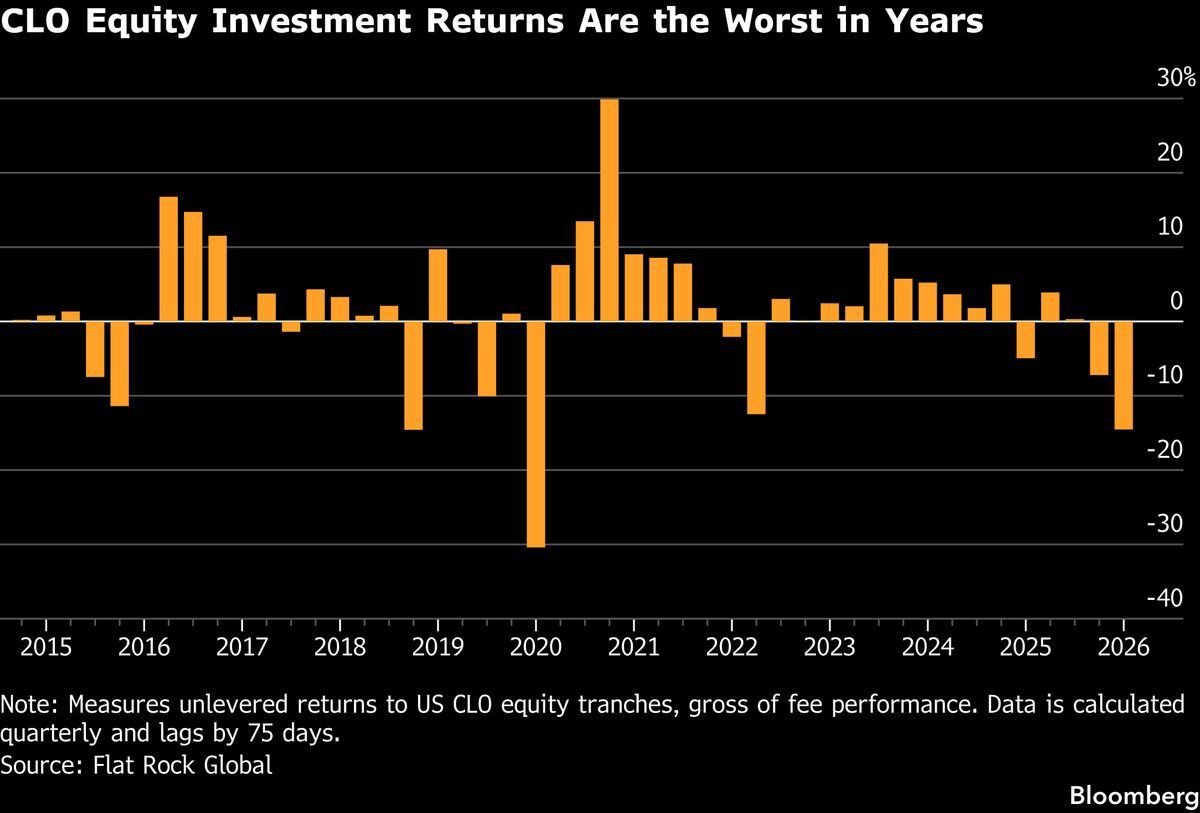
Here is where the dry grass actually is. Returns on the riskiest slice of the 1.3 trillion dollar loan-securitisation market have fallen to their worst in years, with equity tranches down 15% in the first quarter and a second consecutive annual loss now openly discussed. A 580 million dollar listed fund has halved over two years and its managers are publicly fighting over the blame ahead of a shareholder vote. This is not a headline market. It is exactly the kind of leveraged, retail-facing, lightly-watched corner where an equity drawdown stops being a mark and starts being a forced seller. Source: Flat Rock Global / Bloomberg.
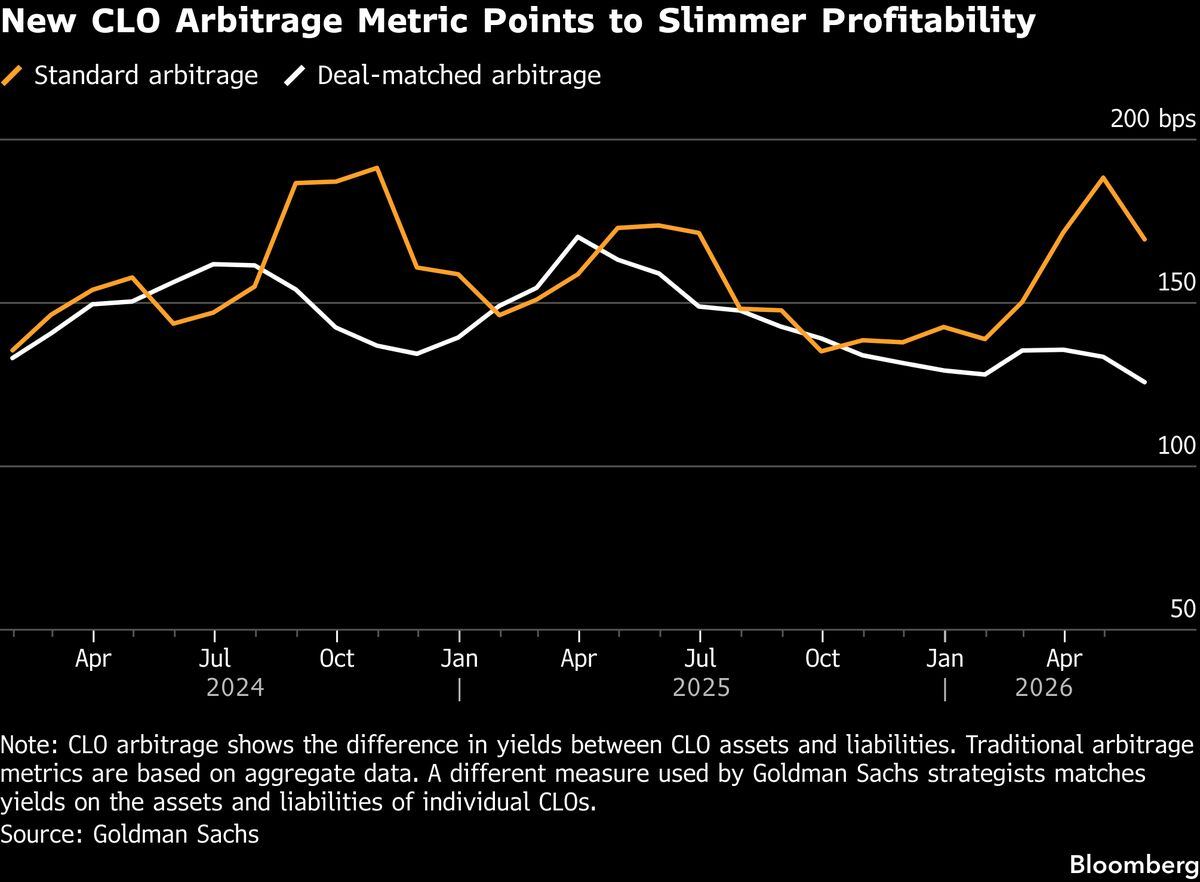
And the economics underneath were thinner than the aggregates suggested. A deal-by-deal reading of the arbitrage, the spread between what these structures earn on assets and pay on liabilities, shows it materially slimmer than the standard aggregate metric implies. Relentless demand from funds and exchange-traded products has bid down the return, while pools raised by managers to buy their own deals remove the outside buyer whose job was to scrutinise the loan documents. Weak underwriting discipline is not visible until the cycle turns, which is the point. Source: Goldman Sachs / Bloomberg.
The AI Tax Gap
A dispatch on the slowest-moving risk in this letter. Fifty finance and technology experts spent two days at the Fund late last year war-gaming how artificial intelligence might break the global economy, and the conclusion was not about rogue systems. It was that the most pressing scenario is the erosion of the income tax base. Roughly two-thirds of US federal revenue rests on taxes on labour, coding is now the most exposed occupation by the labs' own measure and pays nearly double the national average, and revenue would fall exactly as spending on benefits and retraining rises. The historical rhyme is the Engels pause, the four decades from 1801 when British productivity surged while real wages stagnated and the continent convulsed. Replacing US income tax with consumption tax would need a rate near 33%. Every proposed fix, wealth taxes, consumption taxes, corporate rates, a levy on tokens or compute, runs into the same wall, which is that capital is mobile and wages are not.
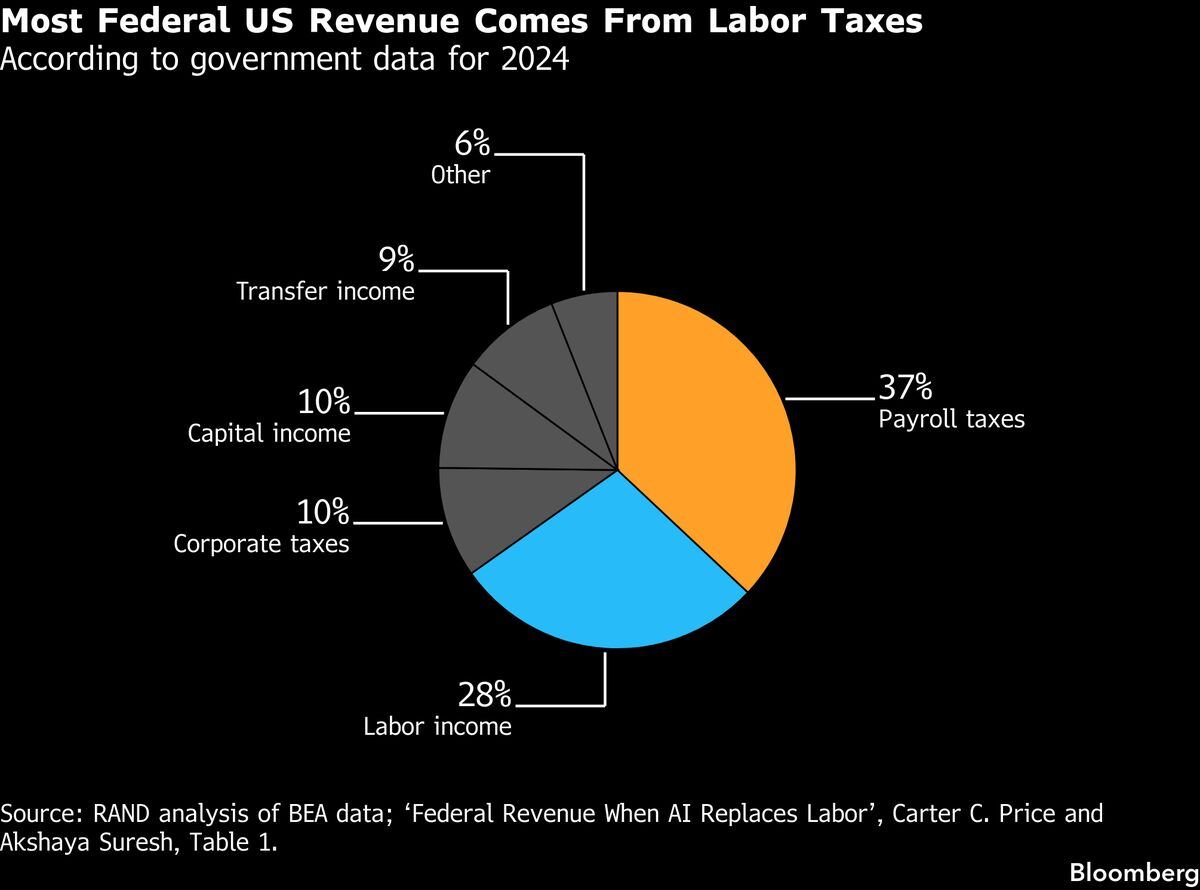
The fiscal arithmetic that makes the AI question a sovereign one. Roughly two-thirds of US federal revenue comes from taxes on labour, 37% from payroll taxes and 28% from labour income, against 10% from corporate taxes. Every government in the developed world runs a version of this. The war-gaming exercise held at the Fund late last year concluded that the most pressing AI scenario is not a rogue system but the erosion of the income tax base, with revenue falling exactly as spending on benefits and retraining rises. Replacing US income tax revenue with a consumption tax would require a rate near 33%. Source: RAND analysis of BEA data / Bloomberg.
VC+ Special Dispatch — The Mid-Year Reckoning
An eight-chart dispatch scoring 2026 against what anyone actually predicted for it. The largest story of the year was not on the card, a coordinated aerial campaign against Iran that has become a closed strait, a naval blockade and the defining macro variable of every week since. Around it sit the slower structural moves, a measured collapse in allied trust, a NATO-wide commitment to 5% of GDP on defence, global growth grinding toward 3.1% with China marked down, an equity index that spent six months blissfully unaware of all of it, and the largest listing in history now trading below its issue price. Read together it is a portrait of a year in which the geopolitical and the financial stopped being separate conversations. Credit to the VC+ team.
The Scorecard
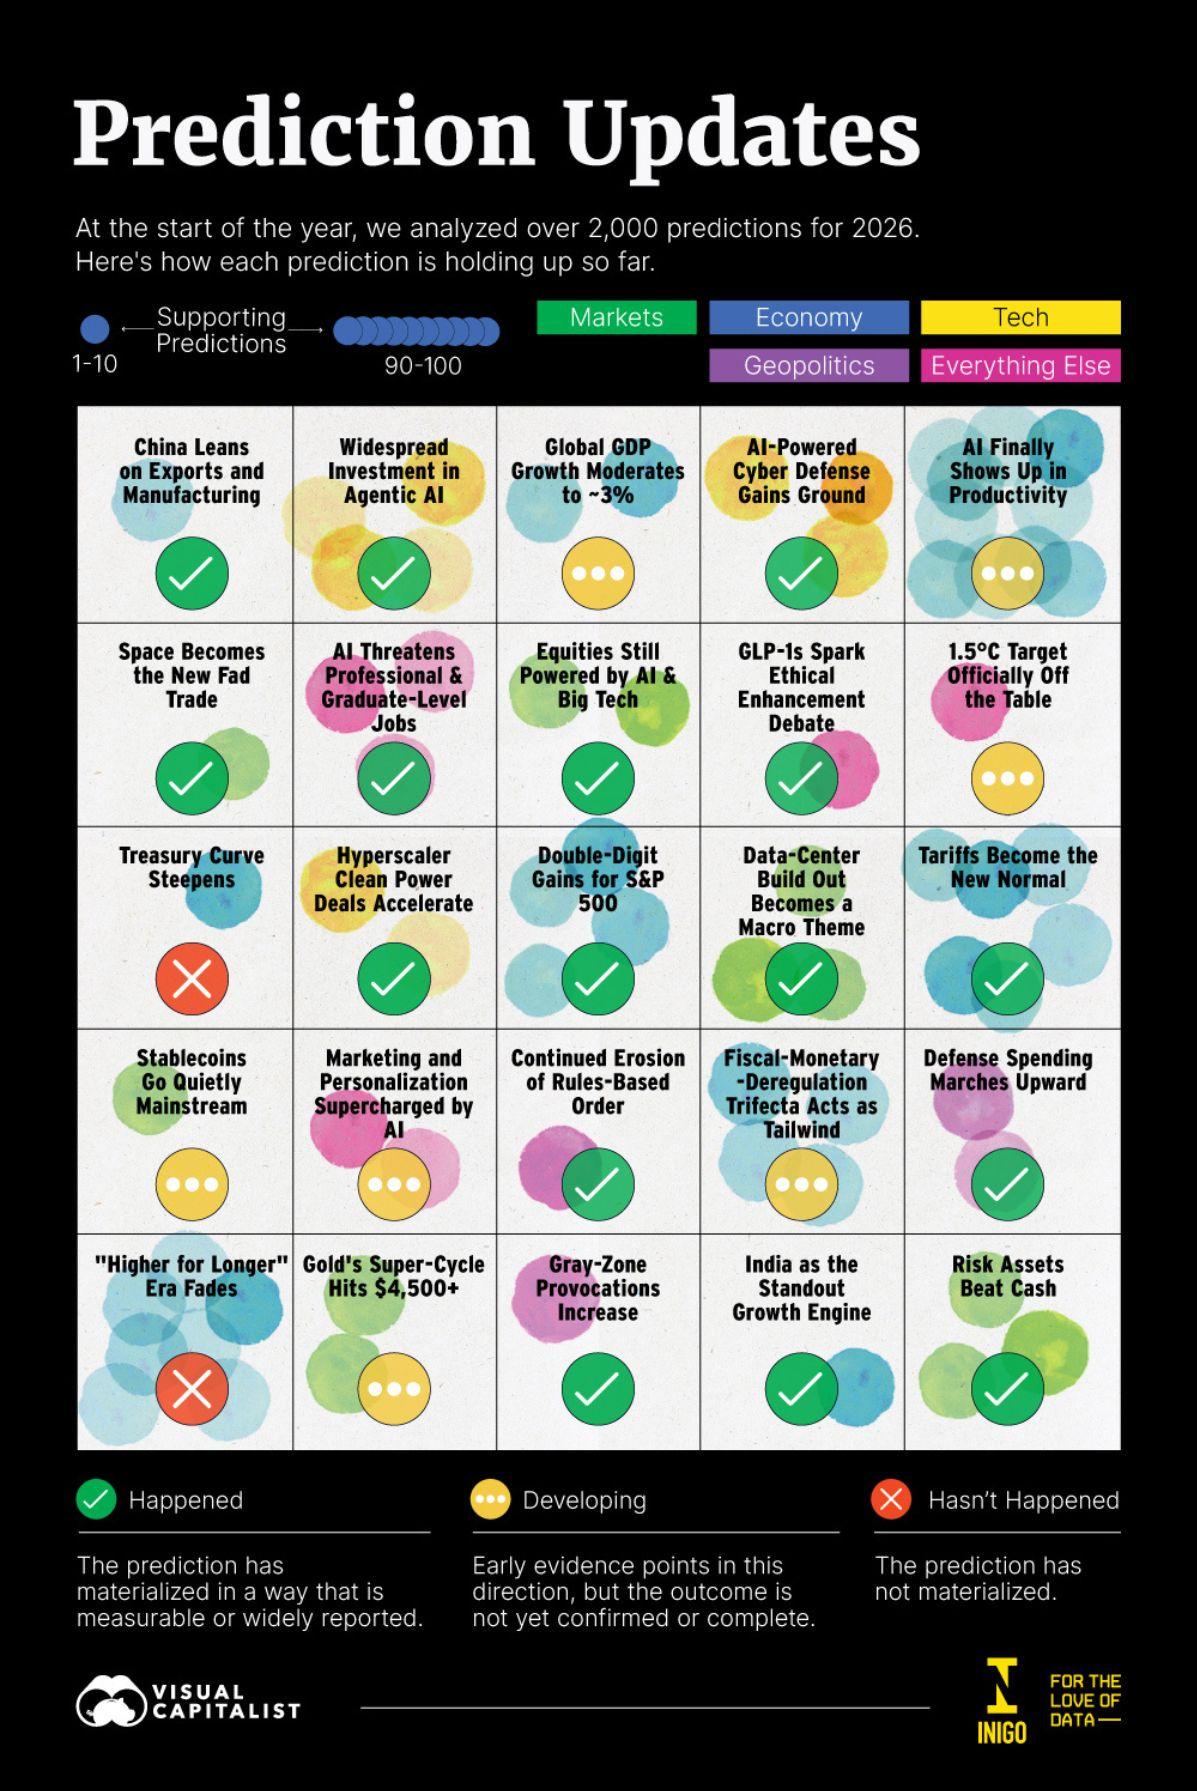
Two thousand predictions, scored at the halfway mark. The master card colour-codes every call made at the start of the year across economy, markets, geopolitics and technology, marking what has happened, what is developing and what has not materialised. Read the greens and the reds together and the pattern is clear enough. The structural calls, tariffs normalising, defence spending climbing, AI concentration deepening, have mostly landed. What nobody carded was the single event that has driven every week since. Source: Visual Capitalist.
A Short-Term Excursion: America and Its Middle East Bases
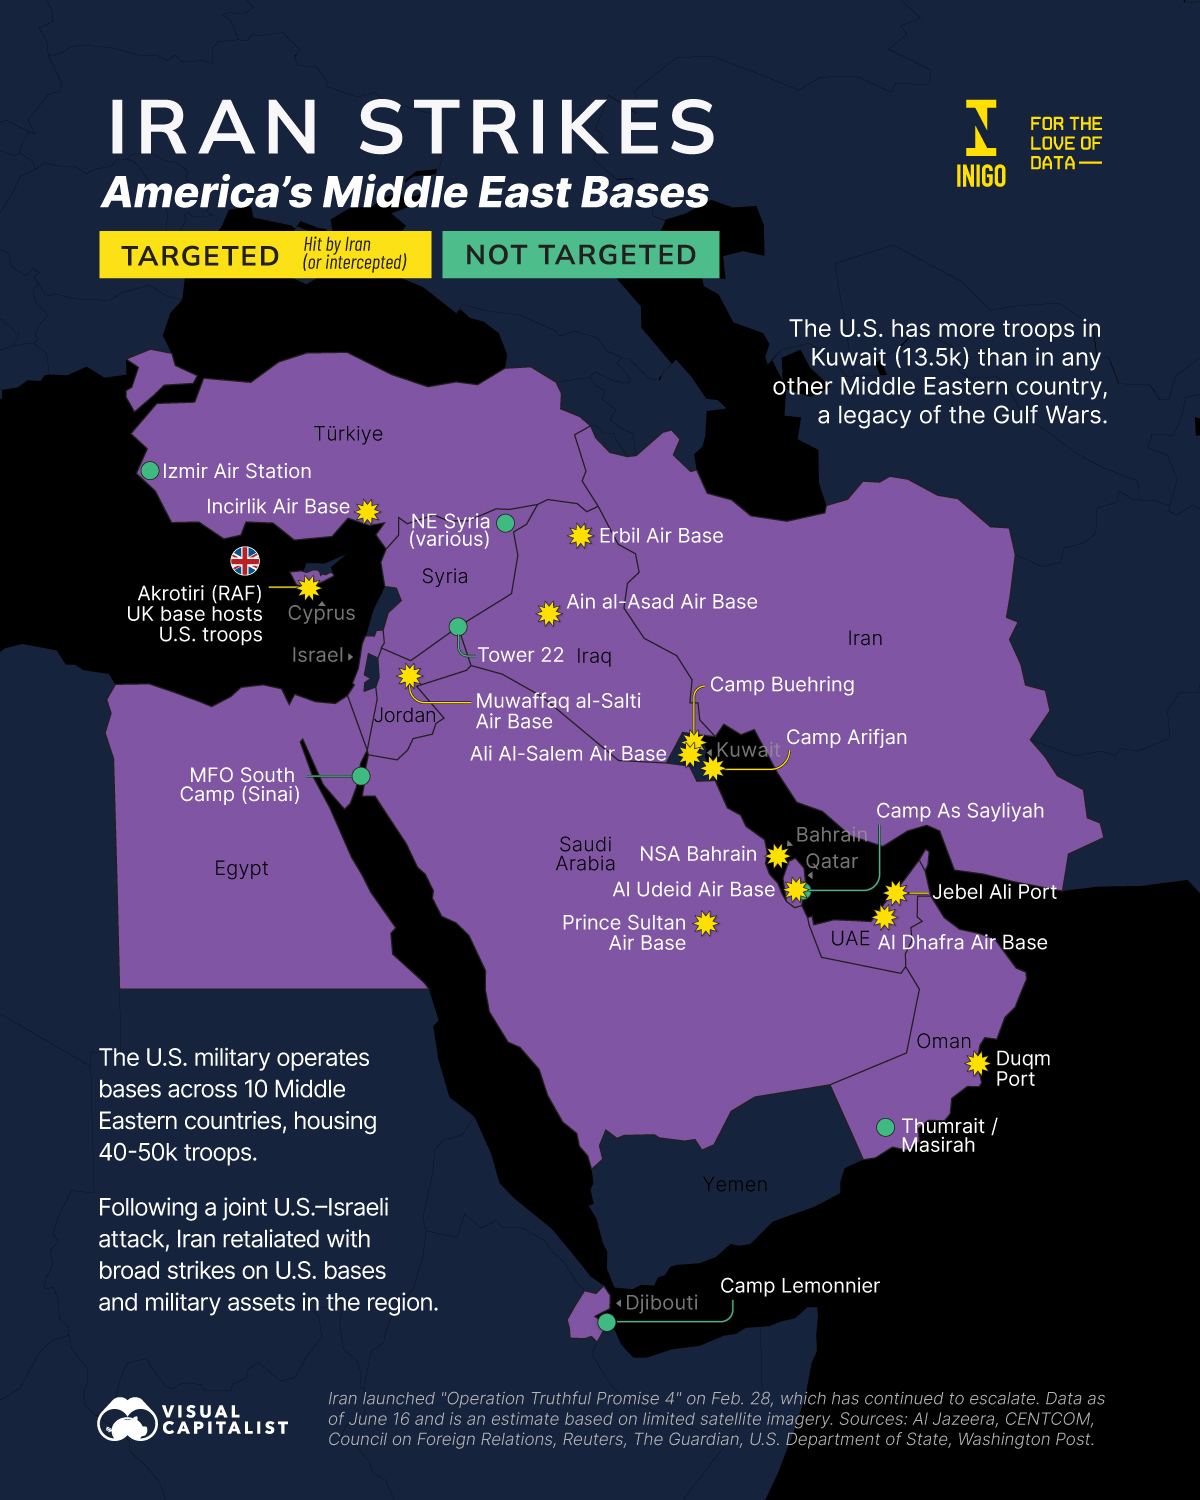
The map of what a short-term excursion actually looks like. American forces operate across ten Middle Eastern countries housing forty to fifty thousand troops, with more in Kuwait than anywhere else in the region, a legacy of the Gulf Wars. The shaded bases are the ones Iran has struck in retaliation for the opening campaign. Every one of those installations is simultaneously a deterrent and a target, which is the structural problem with a posture designed for a different kind of war. Source: Visual Capitalist.
A Short-Term Excursion: What Passes Through Hormuz
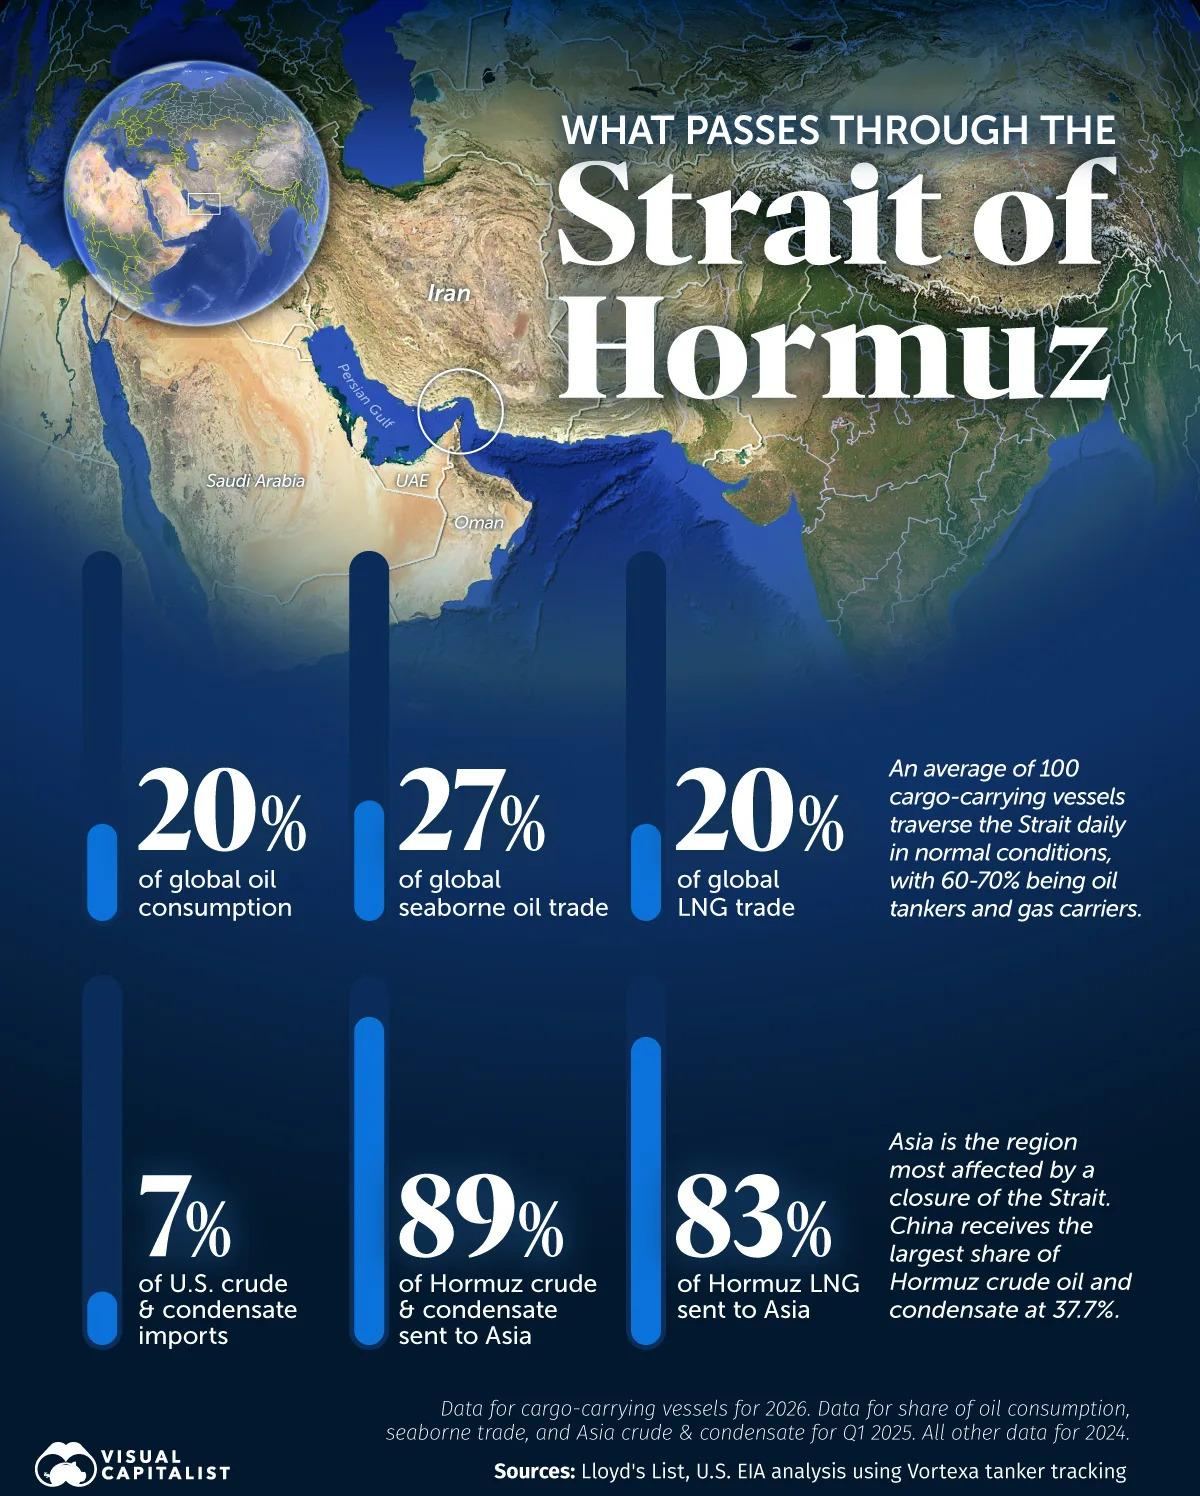
And this is why it is our problem rather than theirs. Roughly a fifth of global oil consumption, 27% of seaborne oil trade and a fifth of global LNG move through the strait, carried by about a hundred vessels a day. But the destination split is the number that matters from here. Eighty-nine percent of Hormuz crude and 83% of Hormuz LNG go to Asia, with China alone taking 37.7%, against 7% of US crude and condensate imports. An American military decision keeps arriving on this desk as an Asian currency and Asian curve problem, and that asymmetry is the entire reason.
The Rules-Based Order: The Calls
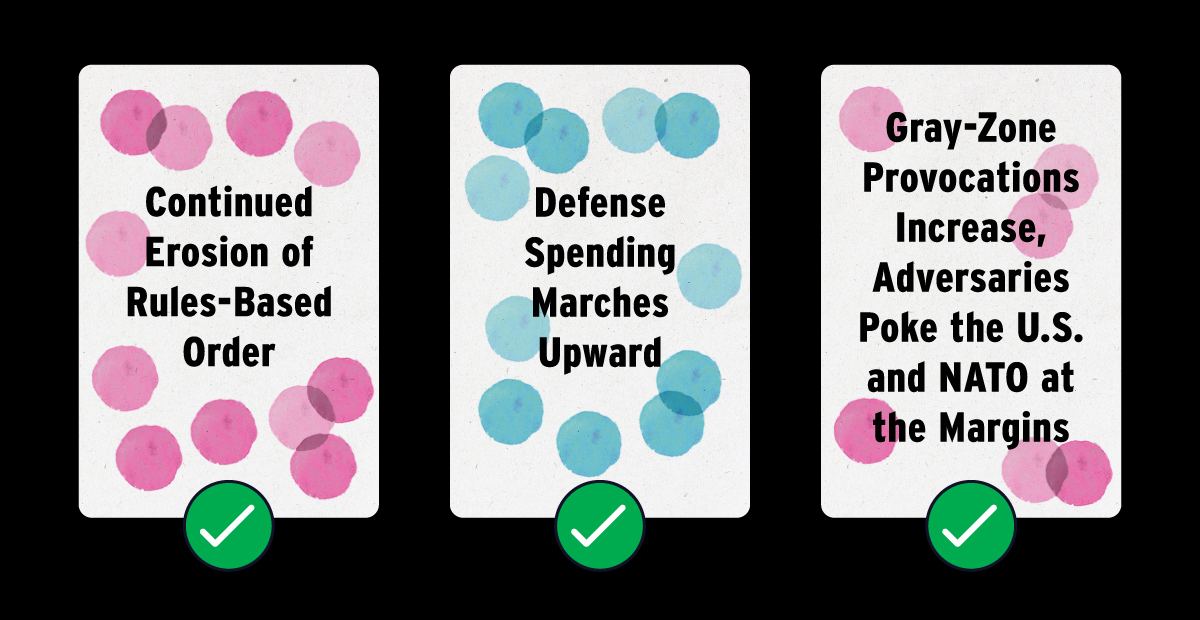
Three geopolitical calls, all marked as happened. Continued erosion of the rules-based order, defence spending marching upward, and grey-zone provocations increasing as adversaries poke at the margins. These were the least contrarian predictions on the board at the start of the year and they have all landed, which should be read less as forecasting skill than as evidence that the direction of travel was already obvious to anyone paying attention.
The Rules-Based Order: Losing Trust
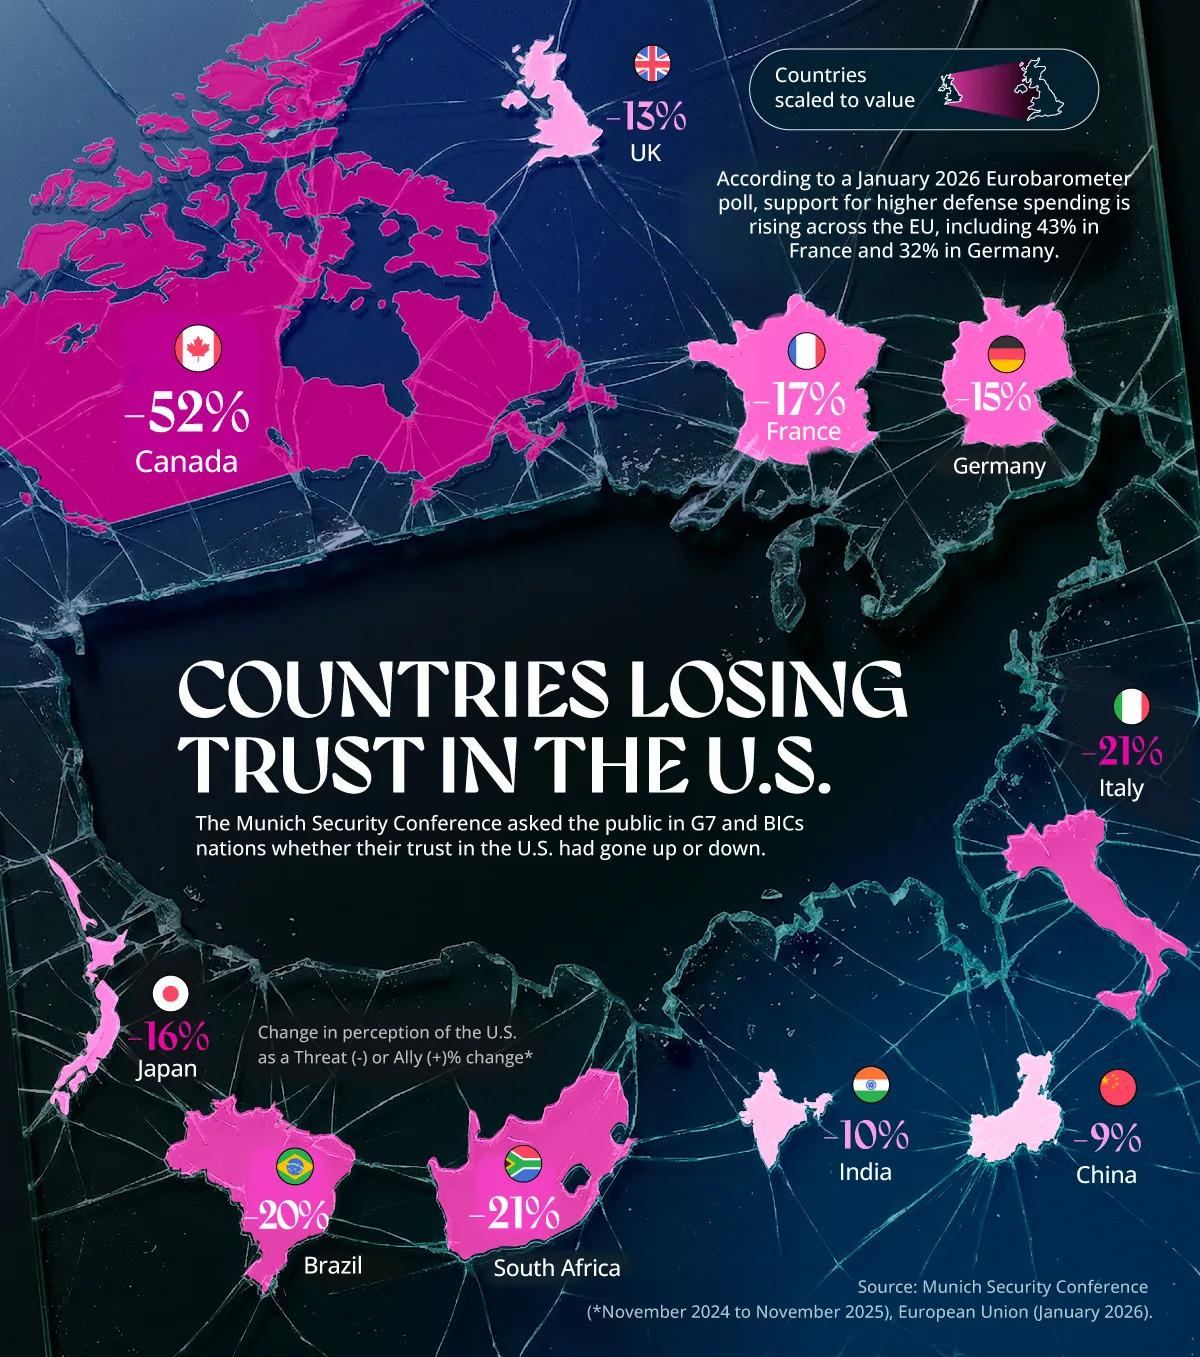
Rupture, measured rather than asserted. Asked whether they view the United States as an ally or a threat, Canadians recorded the steepest deterioration at 52 points, with Italy and South Africa around 21, Brazil 20, Japan 16 and the UK 15. France and Germany moved the other way. Alliance structures are slow and rarely trade directly, but they set the terms on which capital, energy and defence commitments are priced for a decade, and a 52-point swing in your largest trading partner is not a rounding error. Source: Munich Security Conference / Visual Capitalist.
The Rules-Based Order: Defence Spending in Europe
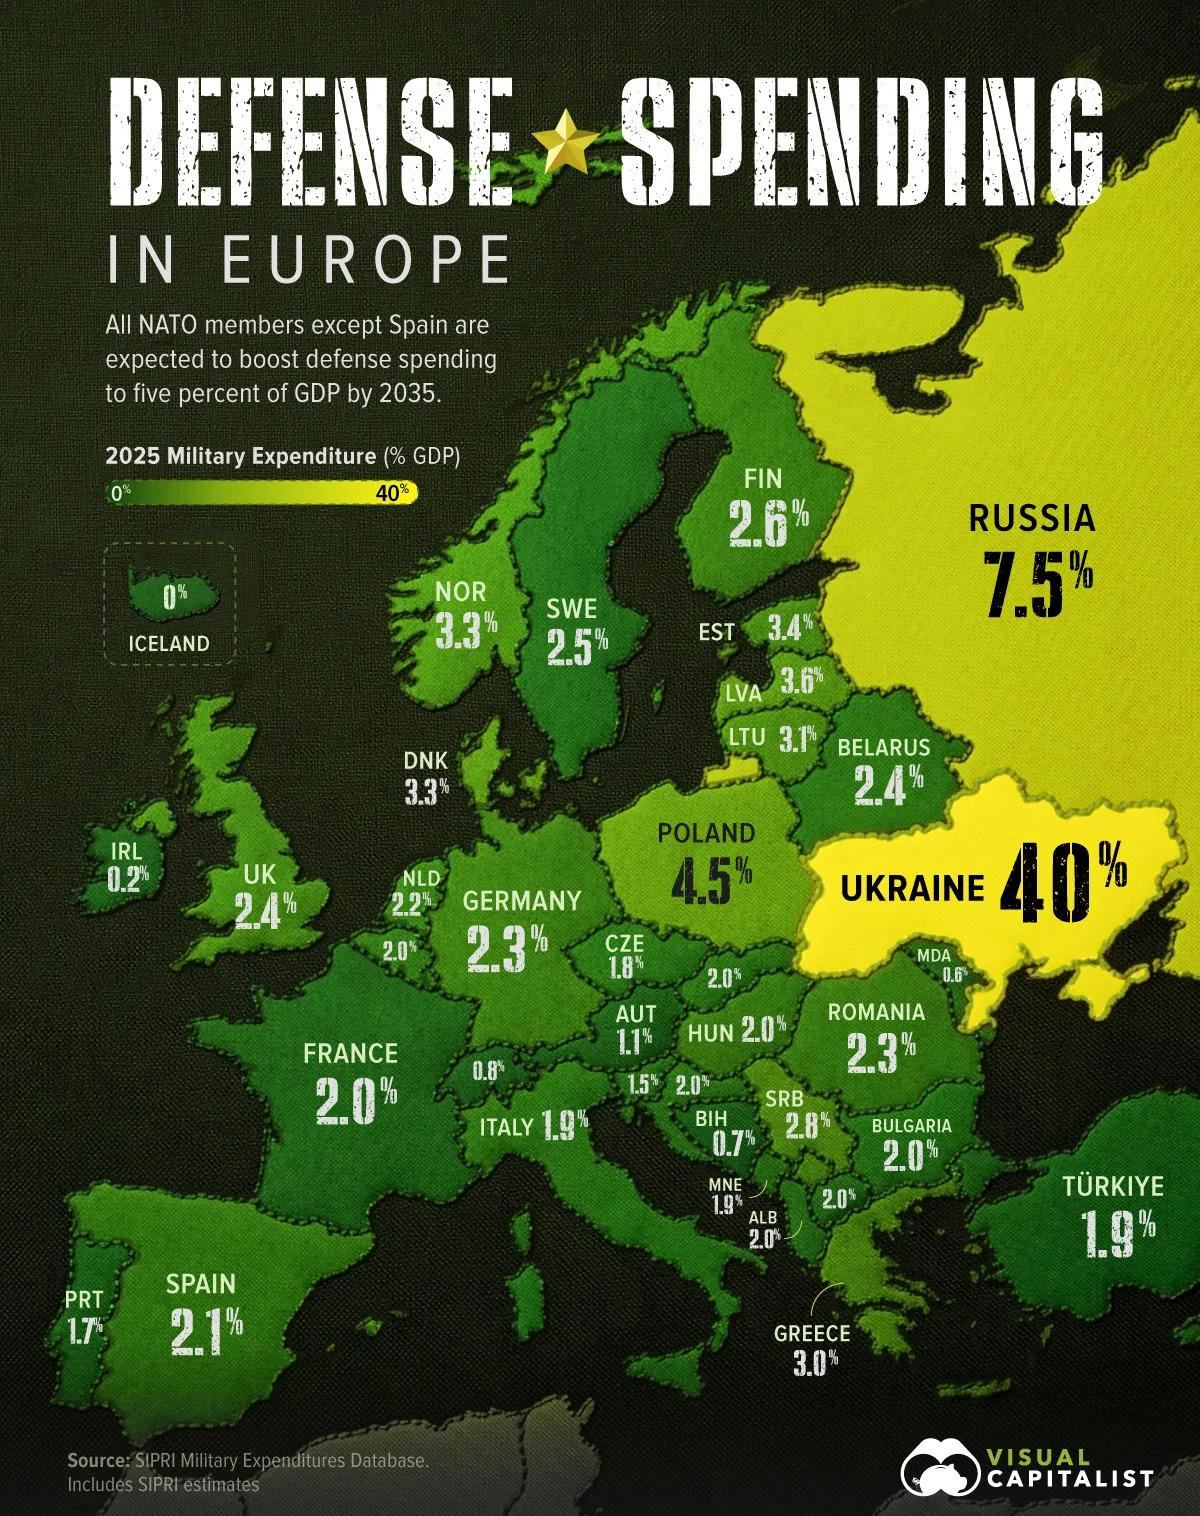
The rearmament that follows, and who is actually paying for it. Ukraine spends 40% of GDP on defence and Russia 7.5%, against Poland at 4.5%, Greece at 3.0%, the UK at 2.4%, Germany at 2.3% and France at 2.0%. Every NATO member except Spain is committed to 5% of GDP by 2035. That is a multi-decade, credit-financed reallocation of European fiscal capacity arriving at the same moment those same governments are being told their income tax base is at risk from automation. Both sit on the same balance sheet. Source: NATO / Visual Capitalist.
Tariffs Everywhere: The Calls
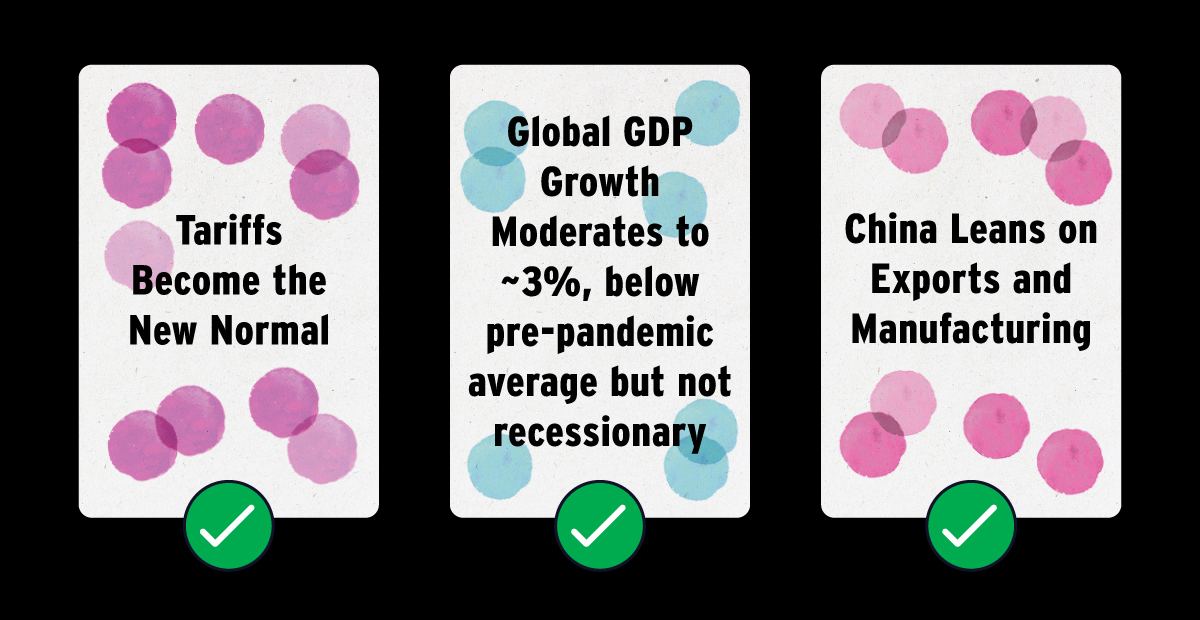
The trade calls, all three correct and all three uncomfortable. Tariffs becoming the new normal, global growth moderating toward 3% without tipping into recession, and China leaning harder on exports and manufacturing. The third is the one that matters most for this letter, because an economy that responds to weak domestic demand by exporting more is an economy that exports its deflation, and it is doing so into a world that has just rediscovered an energy shock. Source: Visual Capitalist.
Tariffs Everywhere: Real GDP Growth in 2026
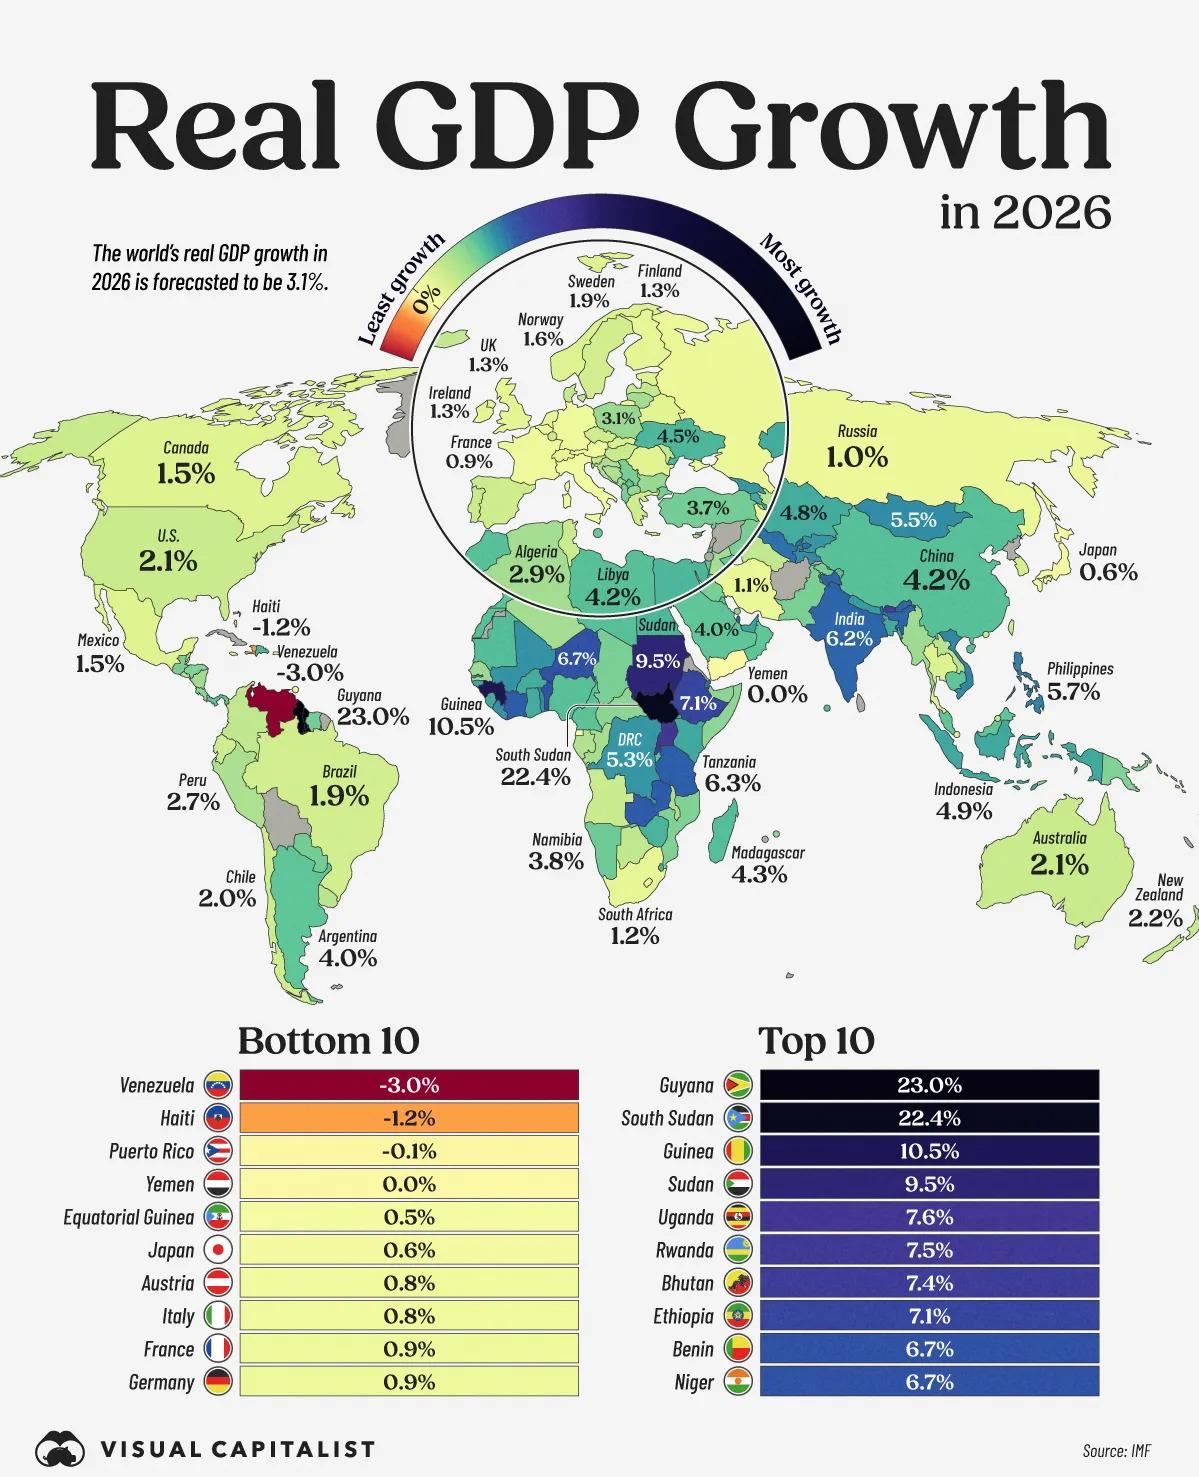
Growth grinds lower, with the marks that matter at the bottom of the pack. World real GDP growth is forecast at 3.1%, with China marked down to 4.2% and the US at 2.1%, Japan at 0.6%, Germany at 0.9% and France at 0.7%. Guyana and South Sudan top the table on base effects that mean nothing for anyone else. China has since printed 4.3% for the second quarter with investment contracting at the fastest pace since 2020, so even the marked-down number is being tested. Source: IMF / Visual Capitalist.
Tariffs Everywhere: Dependence on Chinese Imports
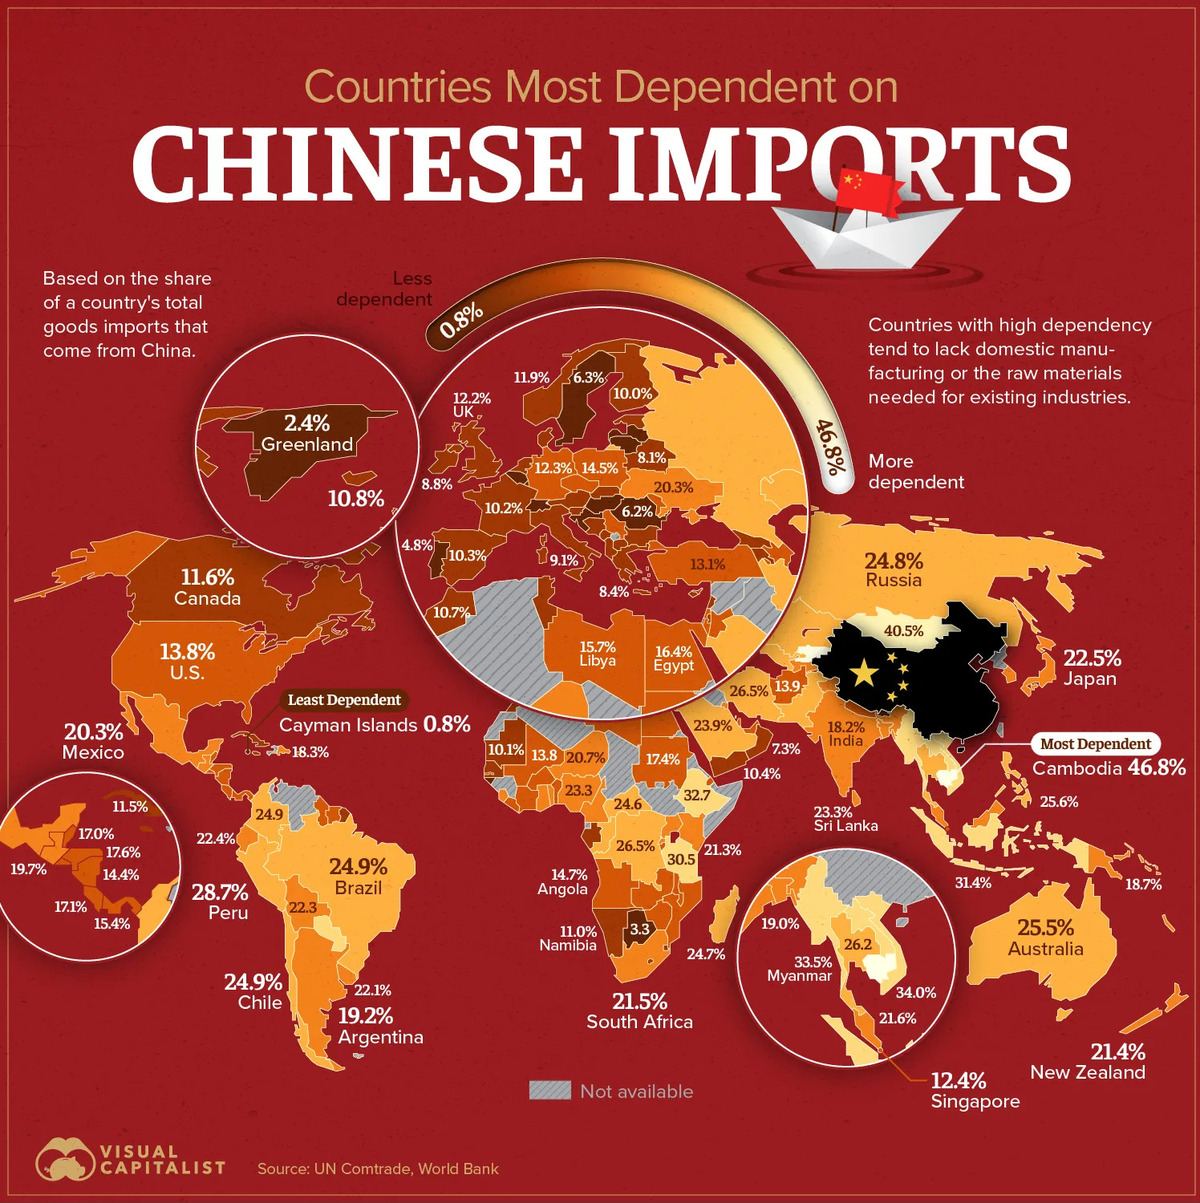
The dependency map behind every tariff conversation. Ranked by the share of a country's total goods imports that come from China, Cambodia leads at 46.8%, with Peru at 28.7%, Australia at 25.5%, Russia at 24.8%, Brazil and Chile near 24.9%, Japan at 22.5%, New Zealand at 21.4%, Mexico at 20.3% and the US at 13.9%. Countries with high dependency tend to lack the domestic manufacturing or raw materials for existing industries. This is the leverage map, and it explains why tariff policy keeps producing outcomes its designers did not intend.
Equities Soar: The Calls
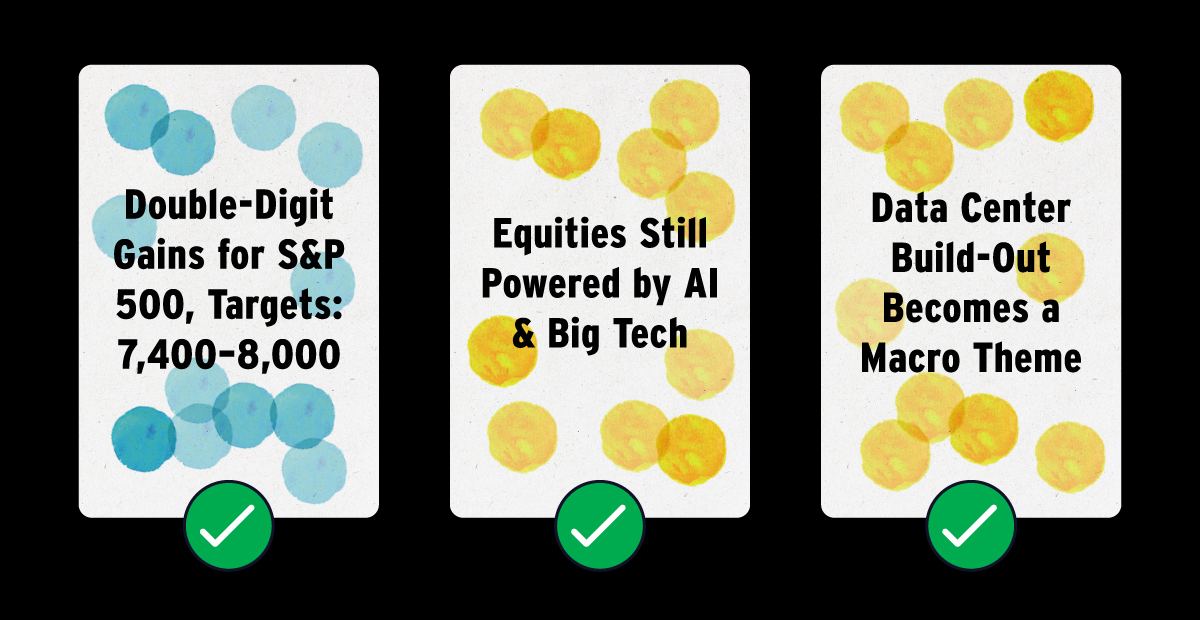
The equity calls, and the one that is now being marked. Double-digit gains for the S&P with targets of 7,400 to 8,000, equities still powered by AI and big tech, and the data-centre build-out becoming a macro theme. All three were scored correct at the halfway point. The third has quietly become the risk rather than the thesis, because a build-out that is a macro theme on the way up is a macro problem on the way down. Source: Visual Capitalist.
Equities Soar: The Entire S&P 500
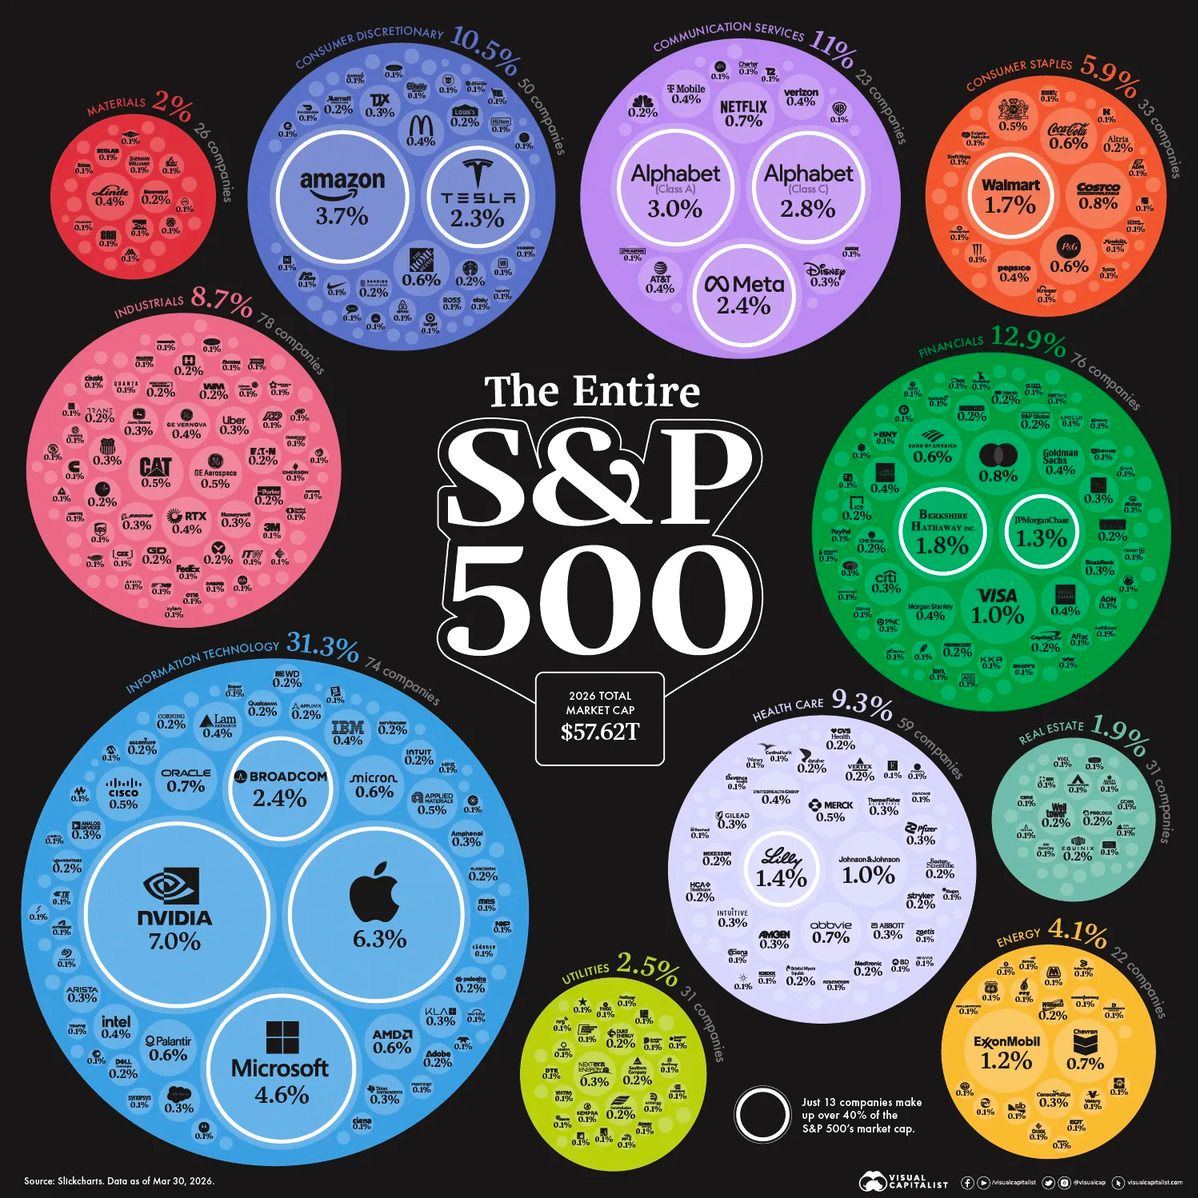
The whole index, drawn to scale. The S&P 500 at 57.6 trillion dollars of market capitalisation, with the chip leader at 7.0% of it, the phone maker at 6.3% and the software incumbent at 4.6%, and information technology alone at 31.3% of the index. This is what concentration looks like when you stop reading it as a percentage and start reading it as an area. A repricing of AI economics does not stay inside the AI complex when the AI complex is a third of the market. Source: Visual Capitalist.
Equities Soar: The Fifty Most Valuable Companies
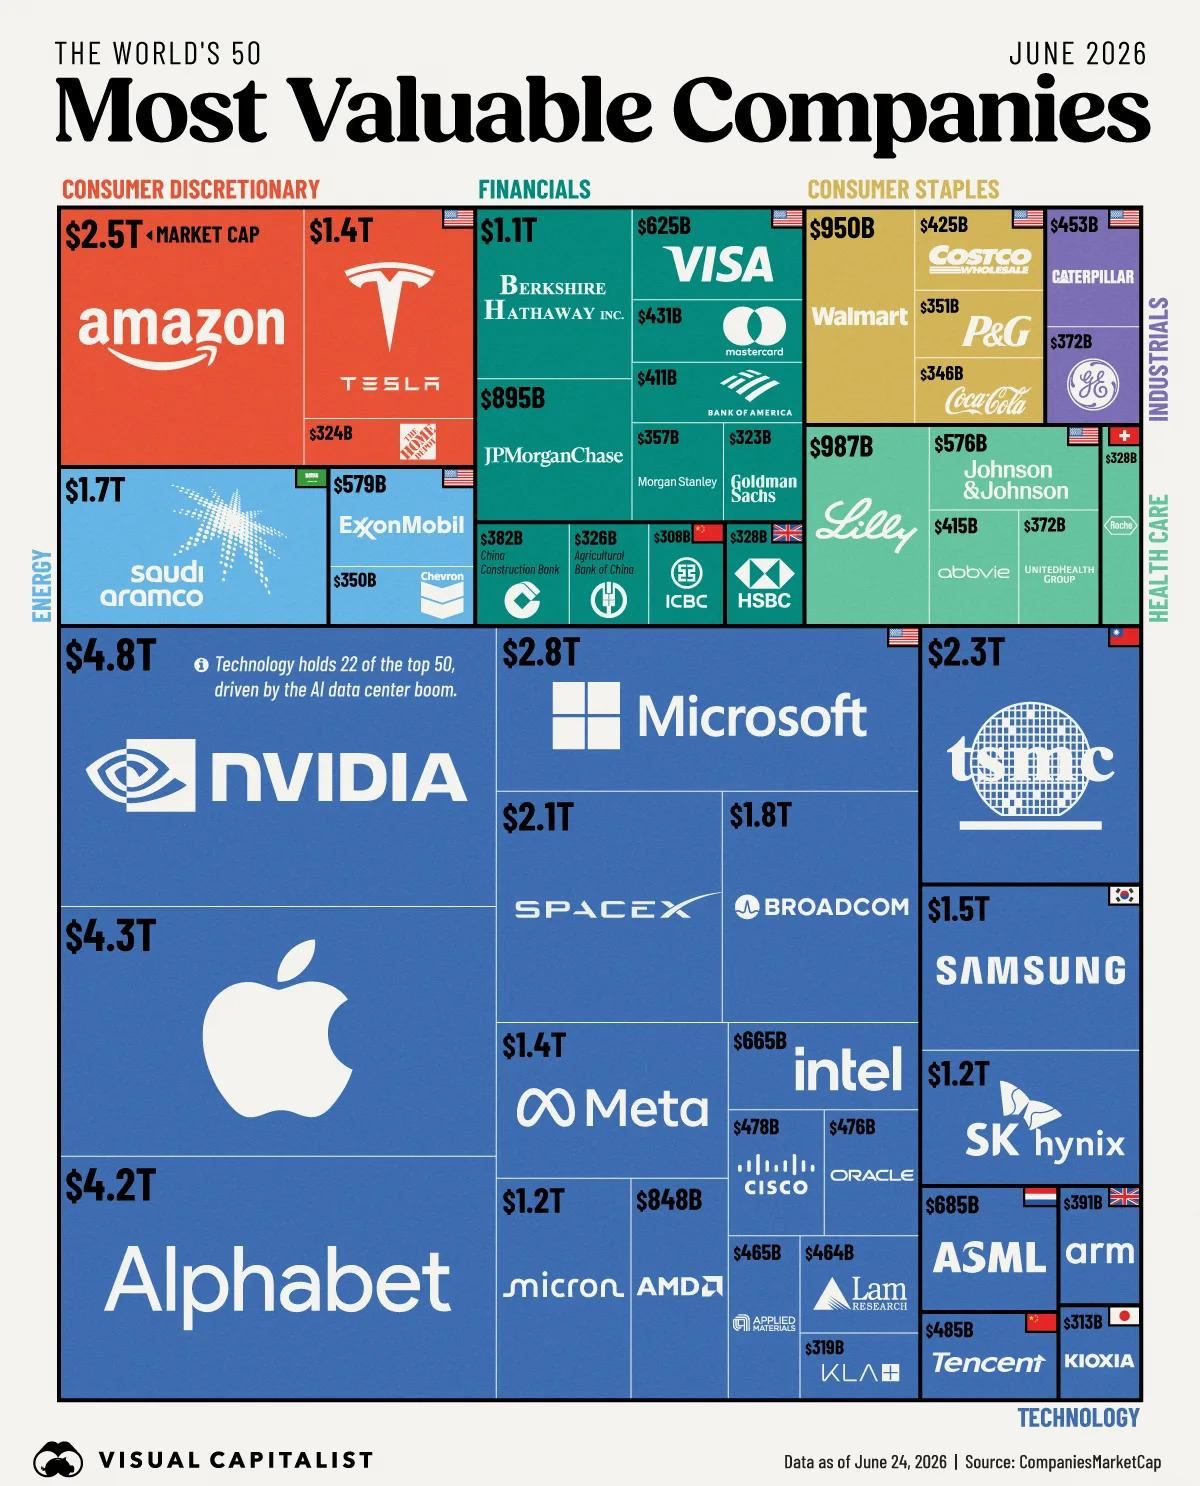
And the same concentration, ranked globally. Twenty-two of the fifty most valuable companies in the world are now technology names, led by the chip supplier at 4.8 trillion dollars, ahead of the phone maker at 4.3 trillion and the search incumbent at 4.2 trillion, with the largest foundry at 2.3 trillion and two Korean memory makers on the board. The data-centre boom put most of these numbers there. It is a useful reminder that the global equity market and the AI capex cycle have become substantially the same trade.
Equities Soar: Where the Compute Lands
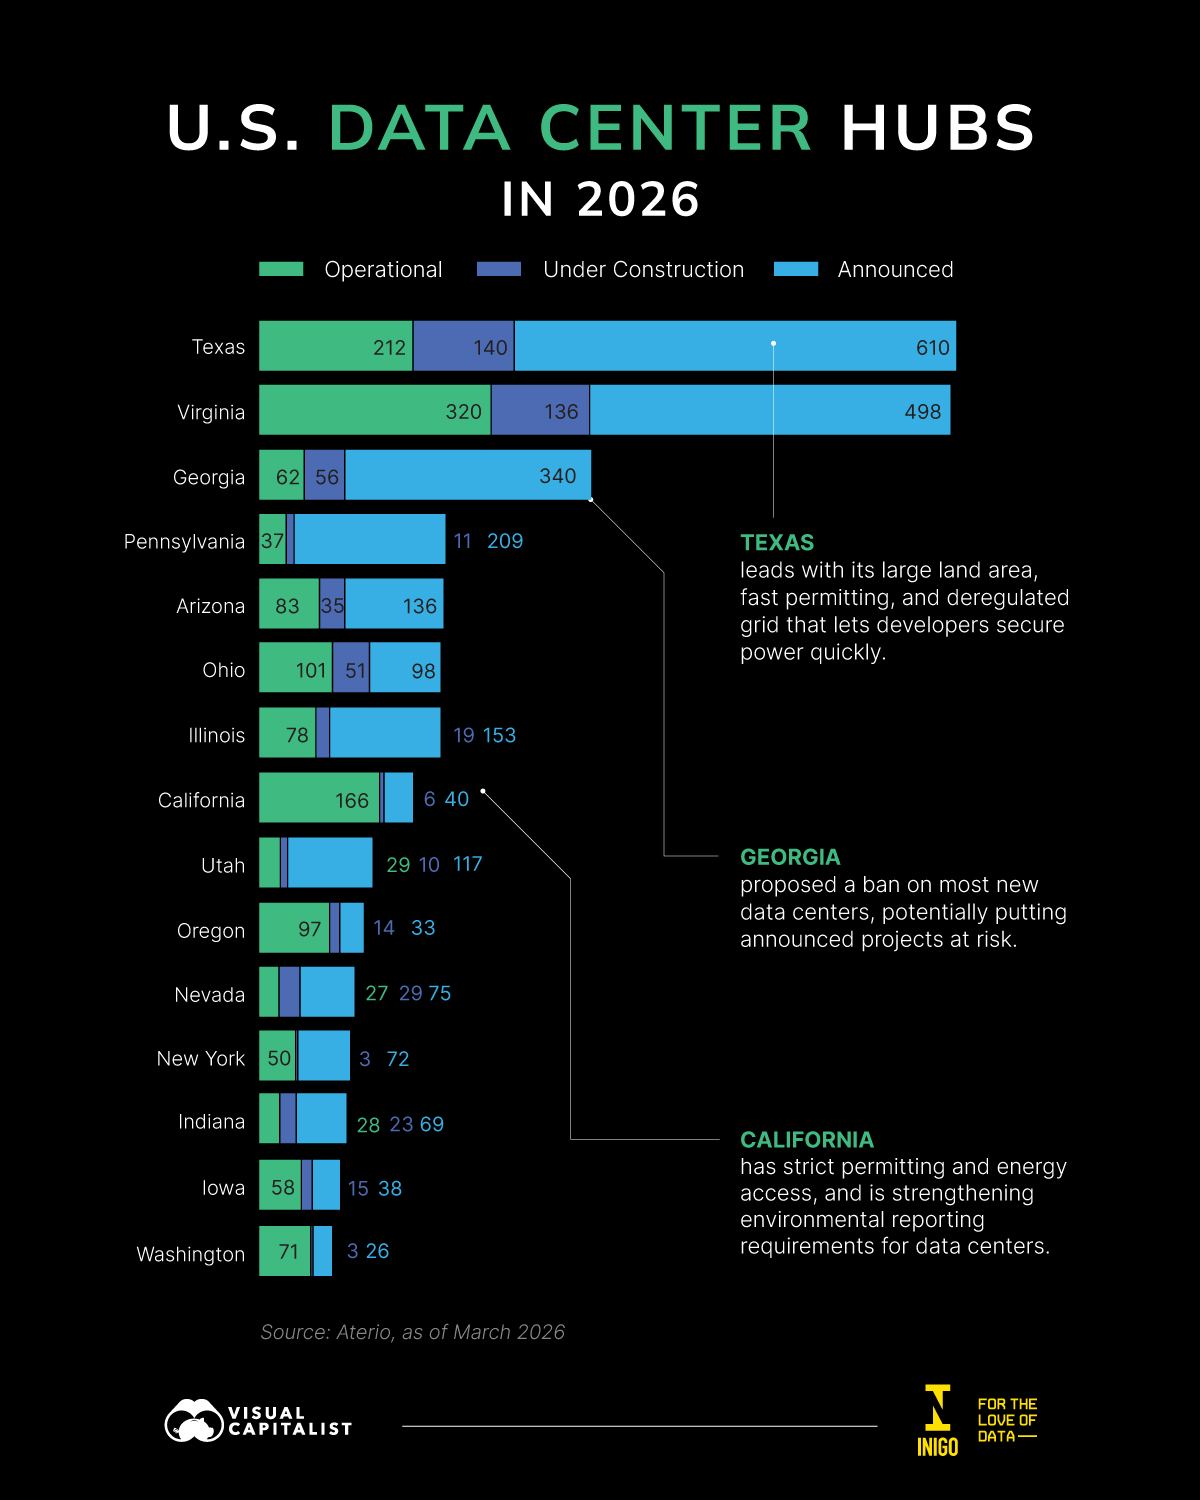
Where the compute is physically landing. Texas leads on operational, under-construction and announced data centres, with Virginia close behind, the former winning on large land area, fast permitting and a deregulated grid that connects power quickly. Georgia has proposed a ban on most new sites that could put announced projects at risk, and California's strict permitting and energy-access rules are pushing developers elsewhere. Steel, land and interconnects get committed years ahead of the revenue meant to justify them, which is the part of this trade that cannot be revised in a quarterly guide. Source: Visual Capitalist.
The Trillion-Dollar Frontier: The Call
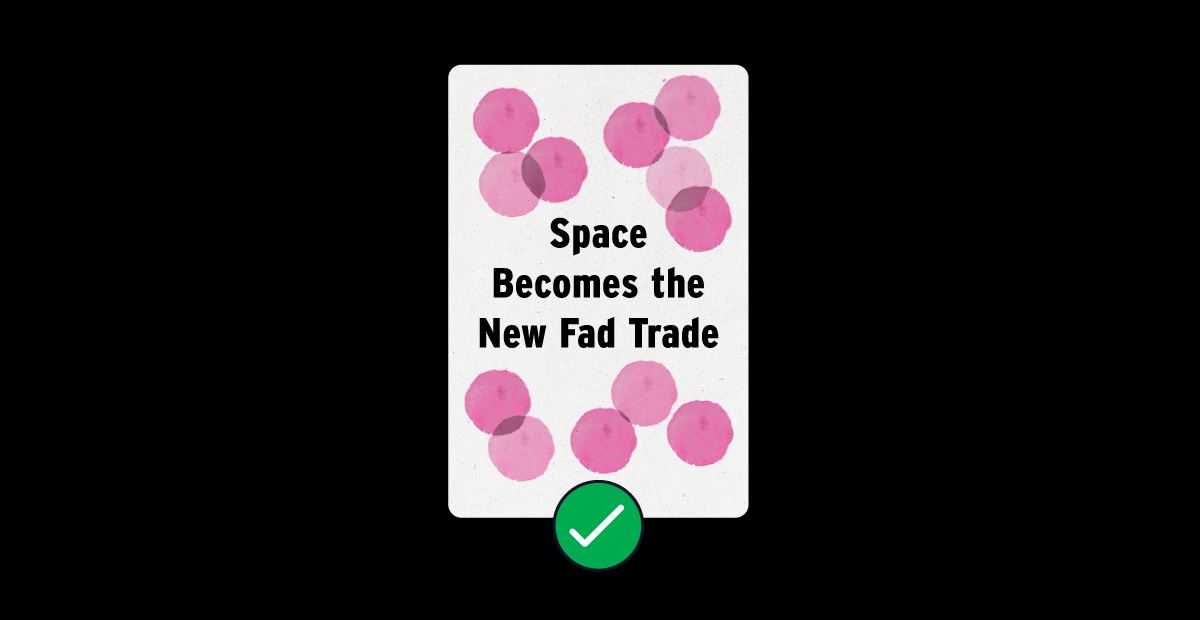
And the call that aged fastest of all. Space becoming the new fad trade was marked correct, which it was, right up until the largest listing in history broke below its issue price. The lesson is not that the prediction was wrong. It is that being right about a theme and being right about an entry are entirely different skills, and the card only ever scores the first one.
The Trillion-Dollar Frontier: The Biggest IPOs Ever
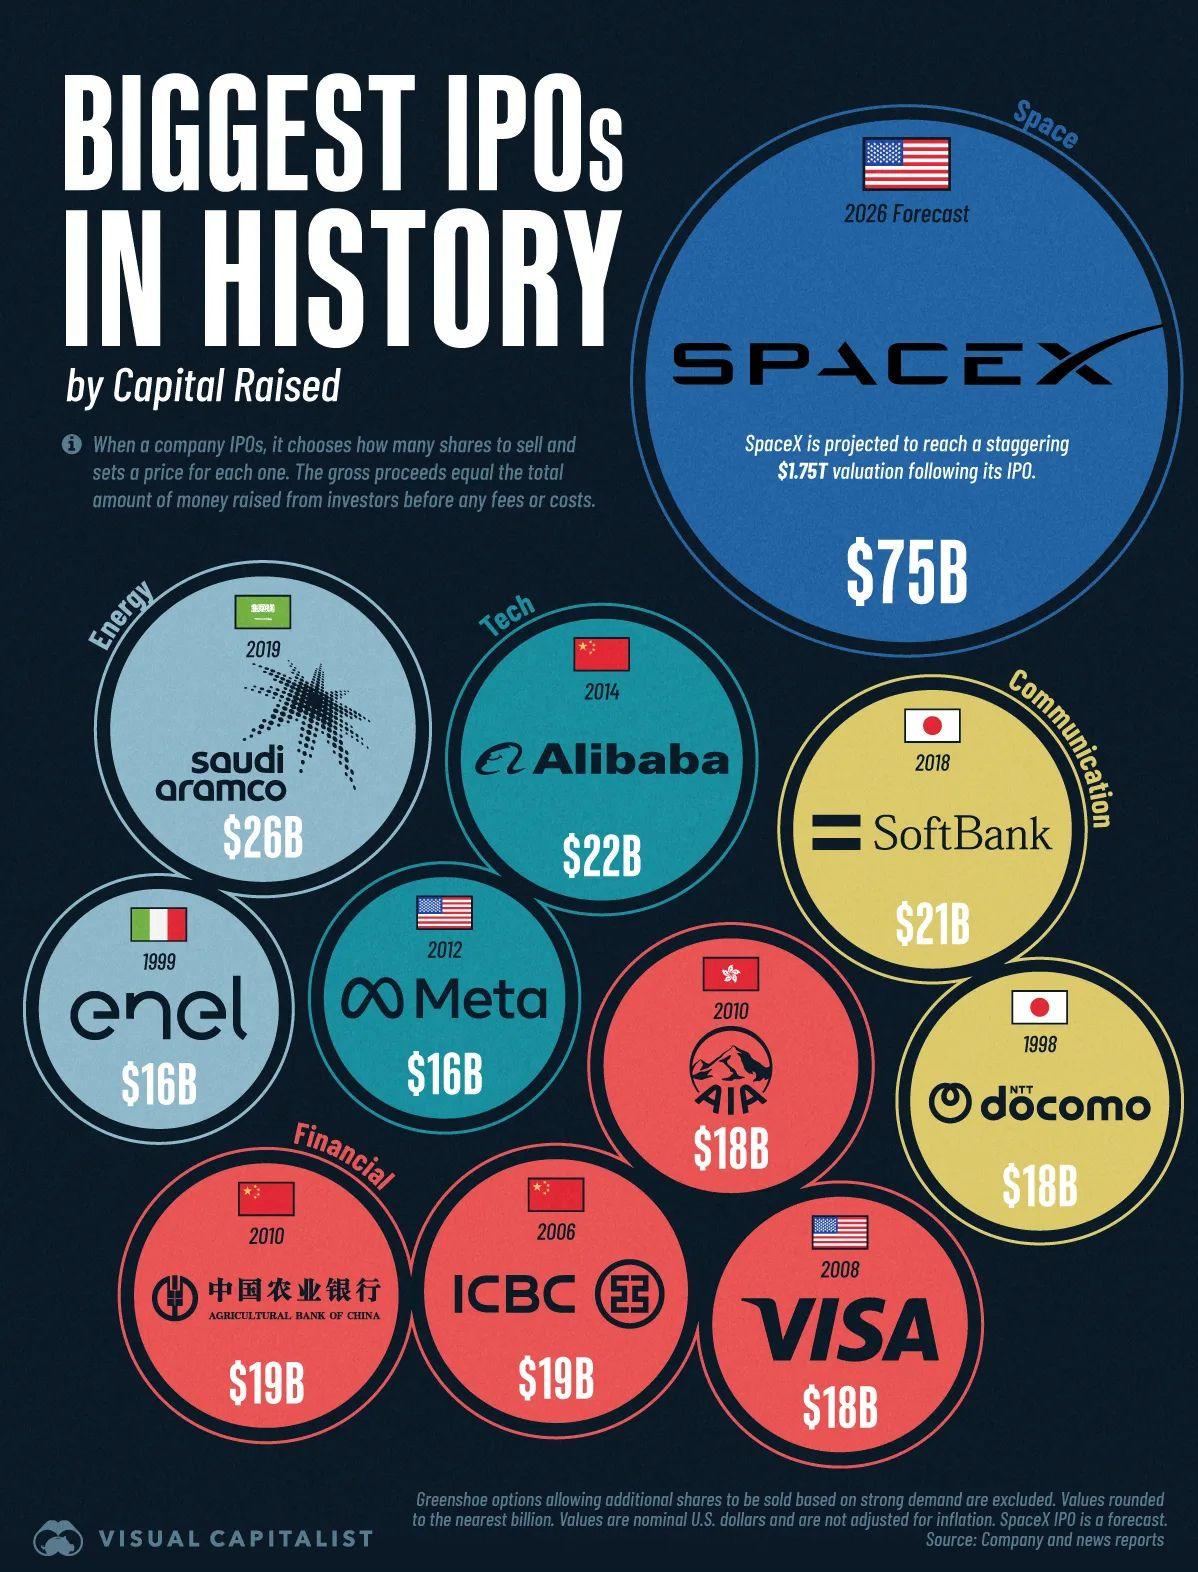
The biggest listing ever recorded, by some distance. Seventy-five billion dollars raised, against 26 billion for the previous record holder, 22 billion for the Chinese e-commerce listing and 21 billion for the Japanese telecom carve-out. A company priced on a projected 1.7 trillion dollar valuation raised more than twice what the world's largest oil producer did. Six months later the stock trades below its issue price with roughly a trillion dollars gone from the peak, which is the fastest round trip from record listing to underwater that this market has produced. Source: Visual Capitalist.
The Trillion-Dollar Frontier: Bigger Than 176 Countries
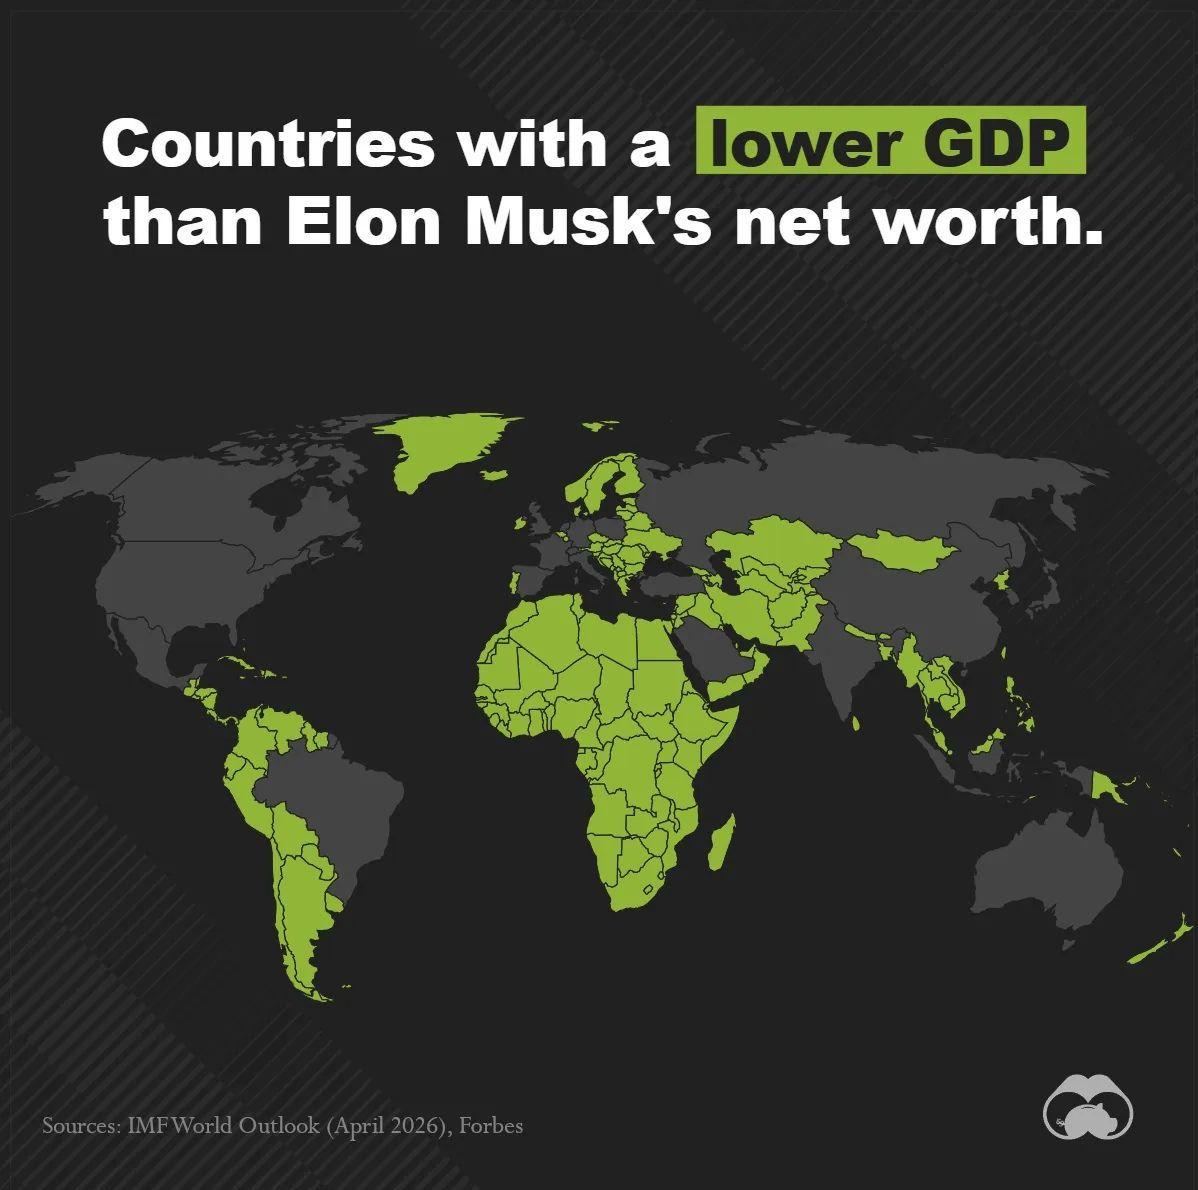
A single fortune now exceeds the annual output of 176 countries. Shaded here are every economy producing less in a year than one person's net worth, which is most of the map. It is a statistic about asset prices rather than productive capacity, and it belongs in this letter for the same reason the tax chart does. A tax base built on wages and a wealth stock built on equity have been diverging for a decade, and the AI transition proposes to accelerate both sides of that divergence at once. Source: Visual Capitalist.
The Trillion-Dollar Frontier: The Richest People
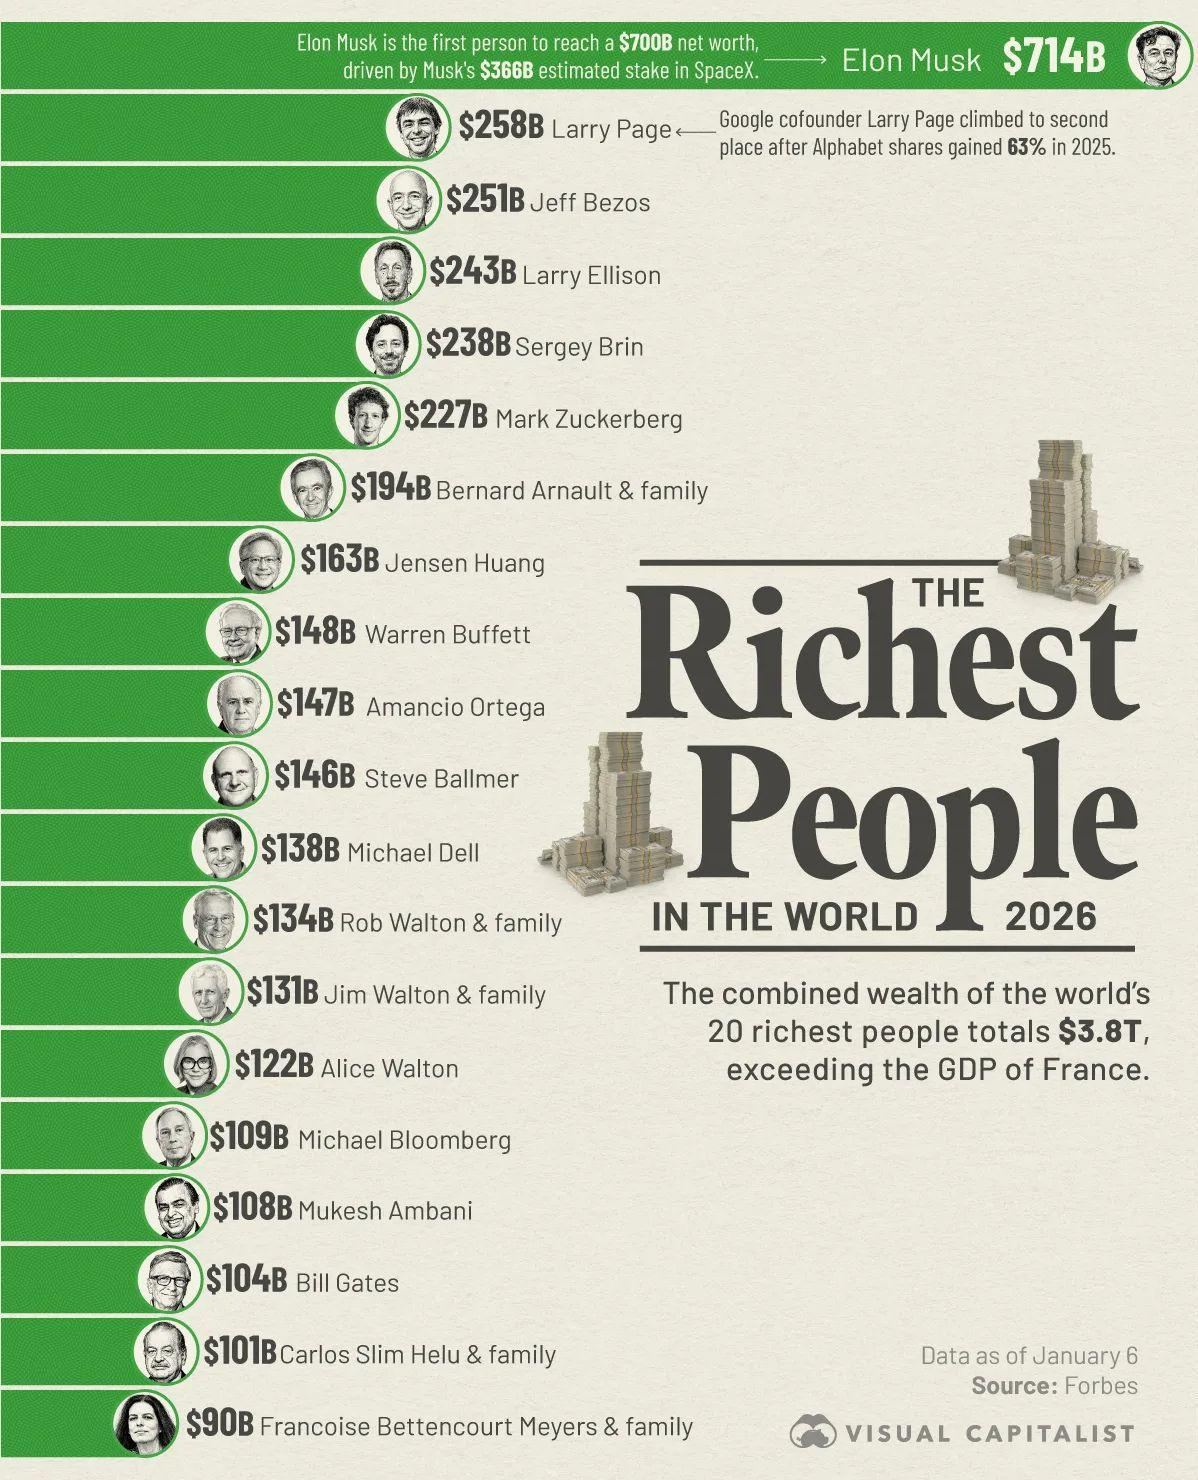
The full ranking, and the concentration inside it. The top name reached 714 billion dollars, the first person ever past 700, driven by an estimated 388 billion dollar stake in a single private company that has since listed and fallen below its offer price. Behind him sit 258 billion, 251 billion and 243 billion. The combined wealth of the twenty richest people is 3.8 trillion dollars, which exceeds the annual GDP of France. Read alongside the tax dispatch above, this is the other half of the same fiscal problem.
The Good Wrap
What is left at the close. A long look at what the Russia and China partnership actually is once you read it off the pipeline volumes rather than the communiques, and why a Russia with one customer changes where the world's marginal barrel gets priced. The uncomfortable tally of who has profited most from the campaign against Iran, worth keeping in view when reading confident forecasts of a quick resolution. The energy map that explains why an interruption in one waterway lands on Asian currencies rather than American ones. And to finish, a matrix of fish sorted by what they actually taste like, which after a week spent arguing about the value of a token is a restful kind of honesty.
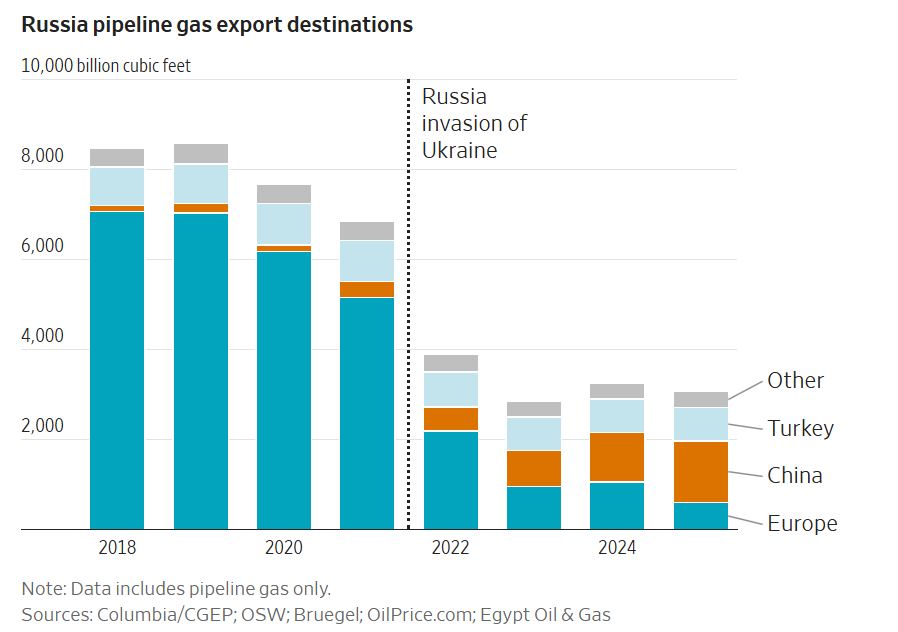
The chart that shows what the partnership actually is. Russian pipeline gas exports have collapsed since the invasion, with the European destination that once took the overwhelming majority of the volume almost entirely gone and China and Turkey absorbing only a fraction of the difference. Read it as a balance-sheet statement rather than an energy chart. Europe was a premium, contractually indexed, hard-currency customer reachable through infrastructure that had been amortised over decades. China is a single buyer, negotiating against a seller with nowhere else to go, on pipelines that mostly still have to be financed and built. The volumes do not replace what was lost and the pricing is materially worse, which is the practical content of the phrase junior partner. The relationship is genuinely deep, it is coordinated on defence, on sanctions evasion, on payment rails and increasingly on technology, and it is not an alliance of equals. Moscow supplies discounted energy, raw materials and military-industrial capacity, and receives components, currency and diplomatic protection on terms Beijing sets. China's calculation is that a dependent Russia is more valuable than a strong one, and Russia's is that dependence beats isolation. For markets the implication is narrower than the geopolitics. A Russia with one customer cannot use energy as leverage against Europe a second time, which caps one tail. But it also means the Middle Eastern barrel is now doing more of the world's marginal pricing than it did in 2022, which is precisely why the strait matters as much as it does. Source: Columbia CGEP, OIES, Bruegel / WSJ. Read more
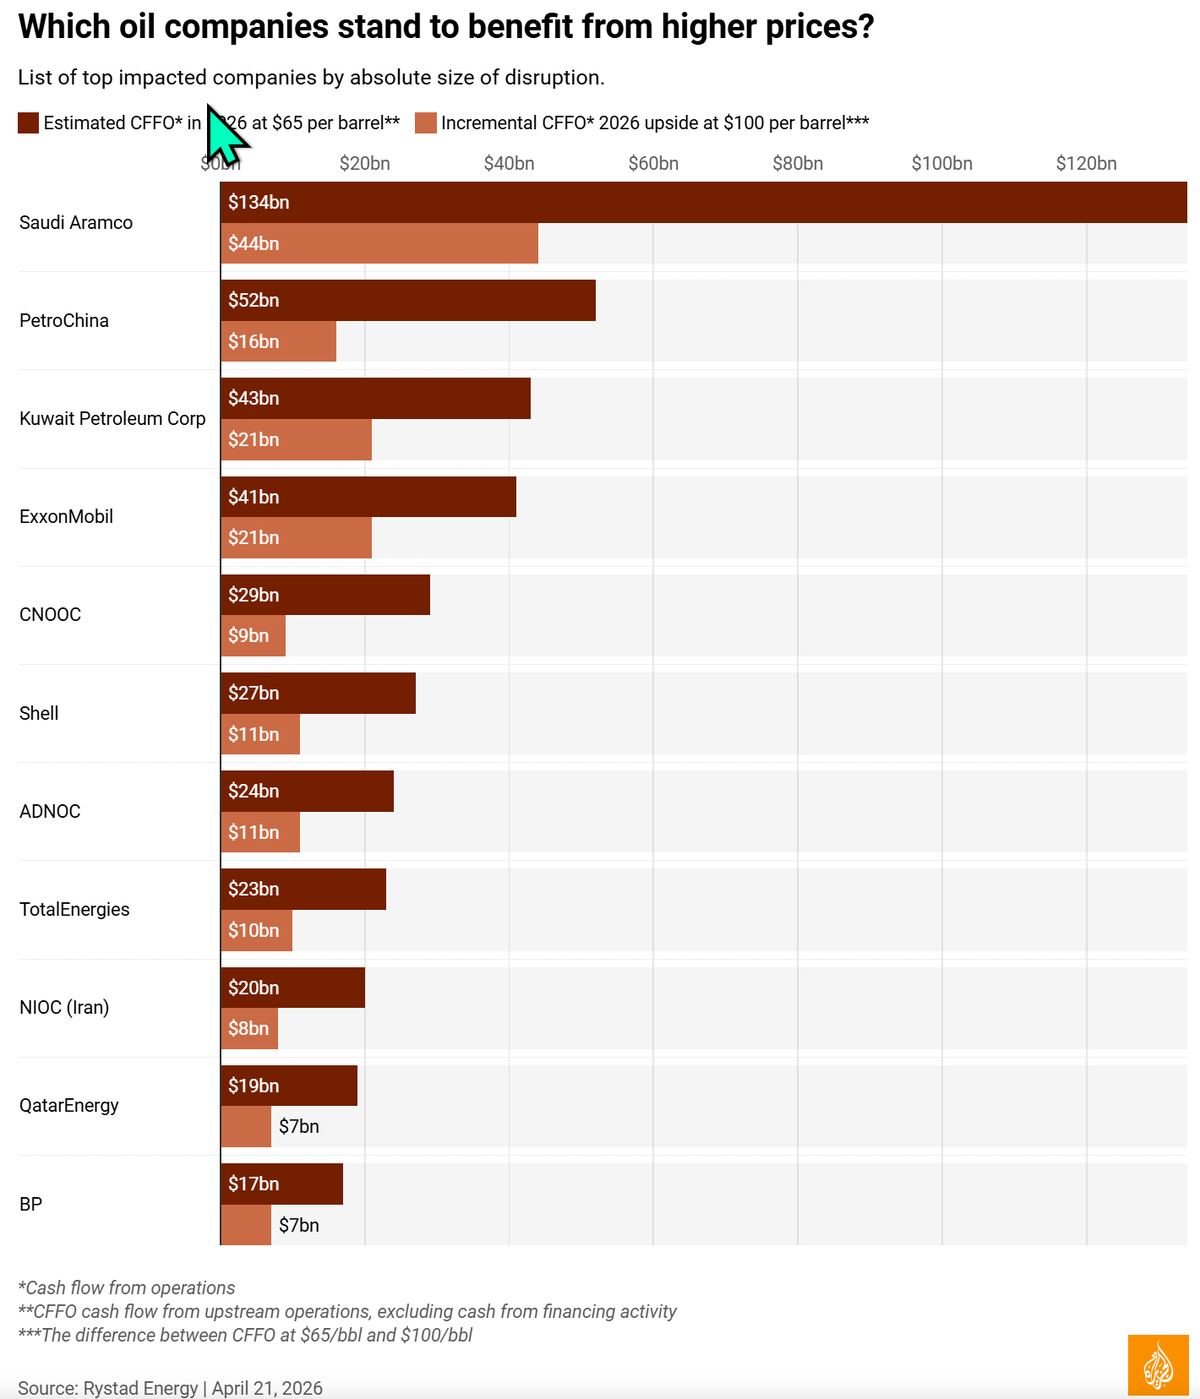
Somebody is always long the war. The tally of who has profited most from the campaign against Iran is the least comfortable chart in this letter, defence primes, freight and insurance, energy majors, and the shipping owners repricing every voyage through a closed strait. It is worth keeping in view when reading anyone's confident forecast of a quick resolution. Conflicts with well-capitalised beneficiaries and no clear victory condition have a way of lasting longer than the base case, and the base case has already been wrong twice this year. Source: Al Jazeera. Read more
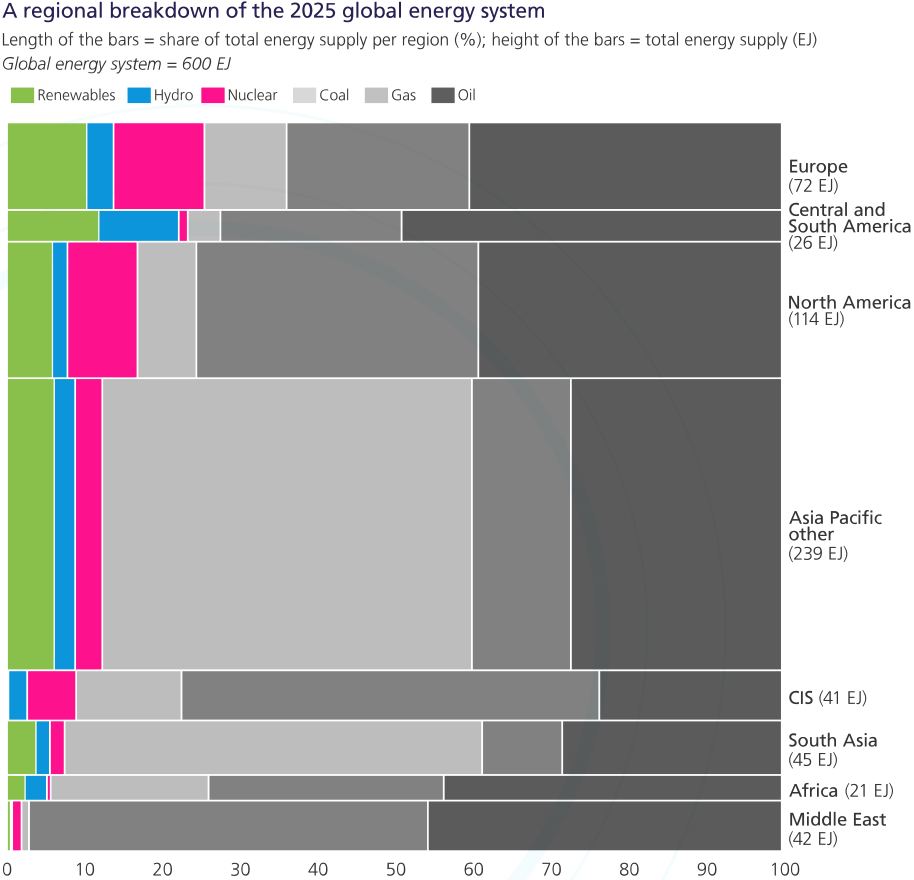
The energy map that explains the transmission. Asia-Pacific drives 47% of global energy use and consumes 83% of the world's coal, while remaining the most import-dependent region on the planet, with India at 86% of consumption imported, Europe at 75% and China at 73%. Fossil fuels are still 86% of global supply even after renewables led the growth. This is the structural reason an interruption in one waterway lands hardest on Asian currencies and Asian curves rather than on the economy that produces its own barrels. Source: DNV Energy Transition Outlook. Read more
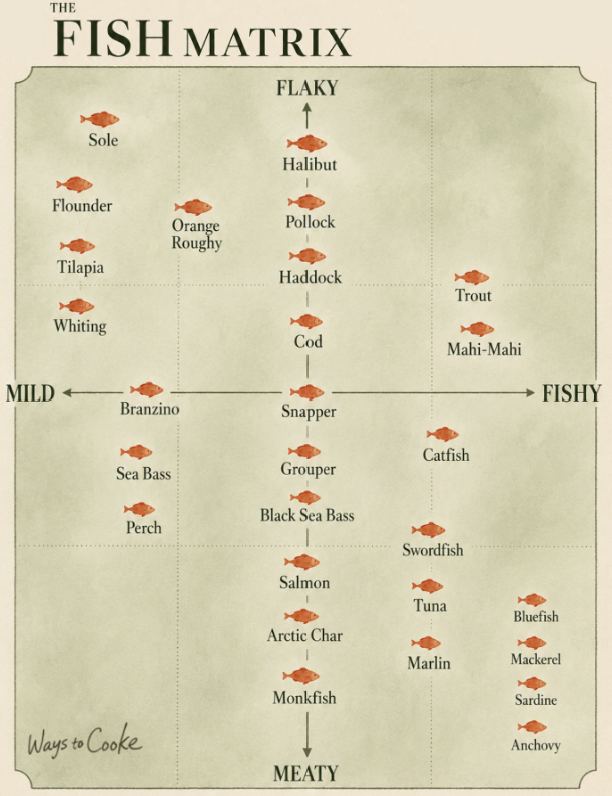
And to close, a matrix with no yields on it. Fish, sorted honestly by texture and flavour rather than by price or reputation, mild to fishy on one axis and flaky to meaty on the other. It is a good reminder that the useful frameworks are usually the ones that describe what a thing actually is instead of what it is supposed to be. After a week spent arguing about what a token is worth, there is something restful about a chart where the anchovy simply is what it is. Source: The Fish Matrix. Read more
Best,
Hoelon
WITPTW is a personal publication. Everything here is personal opinion and market commentary, written in a personal capacity. It is not investment advice and not a recommendation to buy or sell any security. It is not associated with, endorsed by, or representative of any employer, fund or company. Charts and images are reproduced from their original publishers, credited to their sources for commentary and discussion; all rights remain with the respective copyright holders.